

Real Estate Market Intelligence September 2024

Real Estate Market Intelligence
September 2024
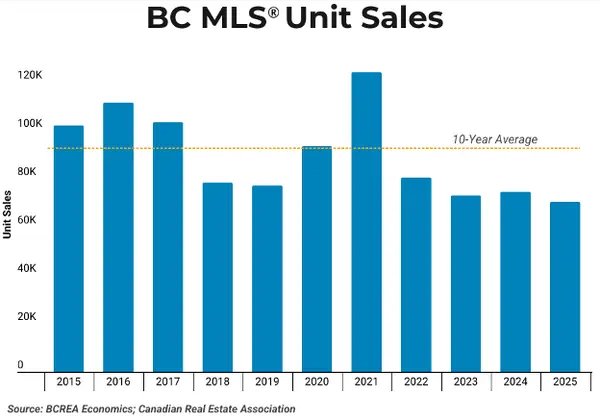
Hope you're having a wonderful tail end of the summer. As the weather is starting to cool, kids are back to school, and most are back to their routine. In August, the Vancouver real estate continued the trend of dull summer, where sales have been horrible (-26% below 10 years average). Many Buyers ghosted the market by going summer vacations, or simply enjoying the weather and puting their purchasing plans on hold. One of the major trends has been the surge of housing inventory throughout the year, which in August somehow ironically coincided with +20.8% above the 10 year average. Looking closely, last month was the first month this year that there was a month-to-month decline in inventory. As supply reaches highs not seen in a decade, so is demand sinking to depths not seen since the global financial crisis 25 years ago. As the market continue to polarize, it has also become increasingly difficult for both Buyers and Sellers to navigate. On one end, another rate cut of 0.25% back in early September was another scratch of the iceberg, and only amount to approx $17 less in mortgage payments of every $100,000 borrowed. Even with the rates being reduced, it is still less than the comfortable range (2.5-3%) where the Buyers want to move in. As for the Sellers, pricing the home correctly remain a monumental task in the current volatile market. As inventory piles on, most Sellers now feel like they have more competition and is playing catch up. It does seem like some Sellers are softening their stance a little, given that their home that was listing in the dull summer had no action, abd they may decide to reduce price and give it a good push.
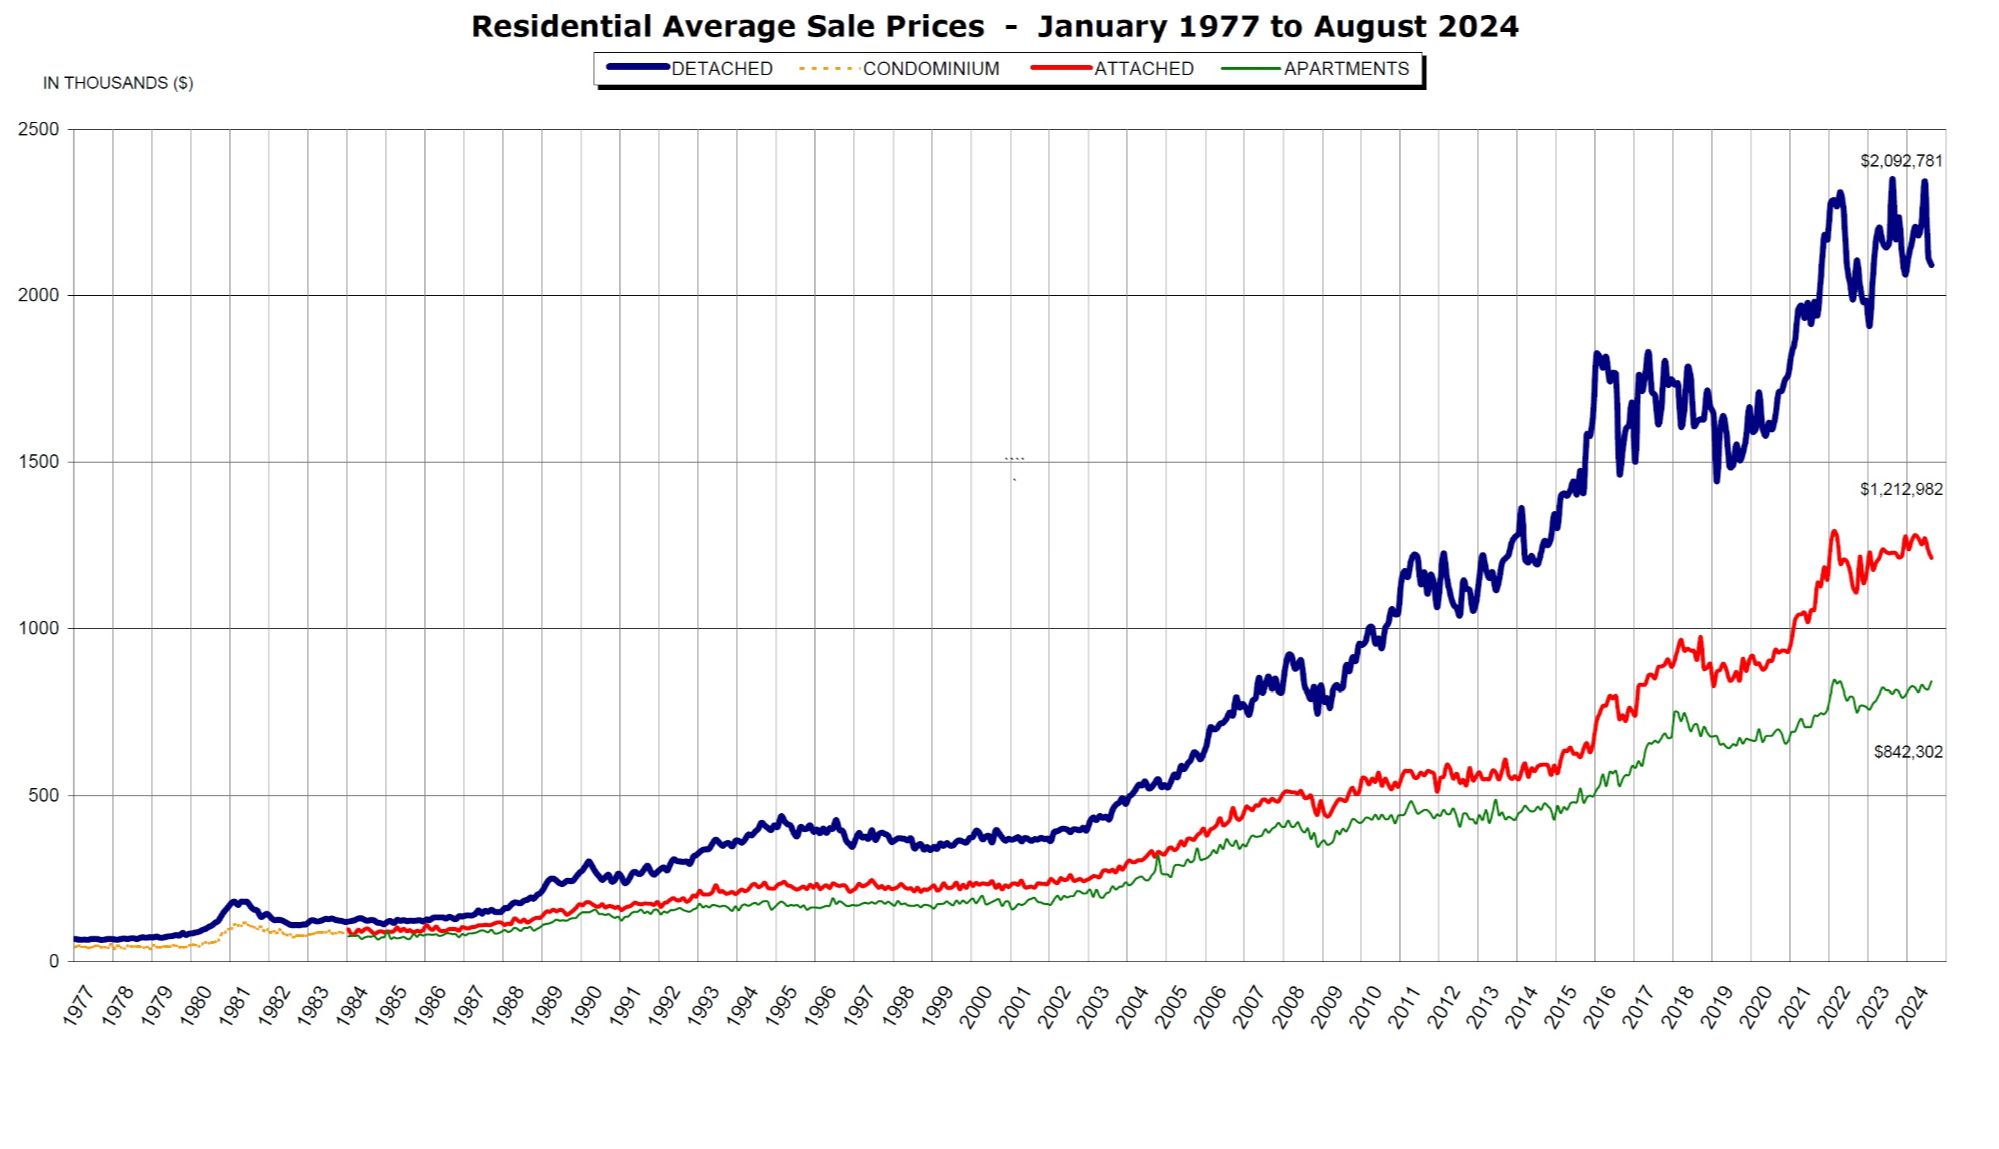
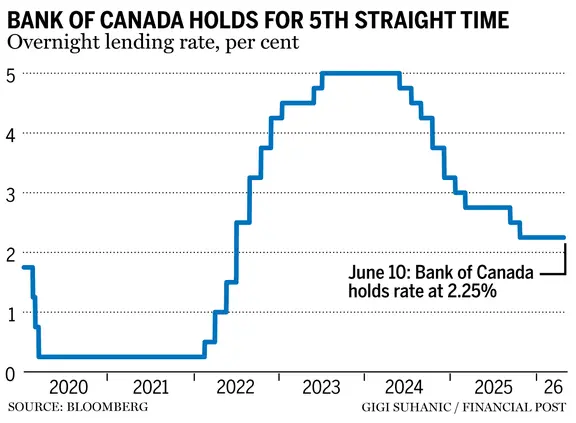
For the Canadian economy, the weakness and cracks continue to show with unemployment rate trending up again at 6.6% last month (+0.2% from July). Even with more rate cuts on the horizon, there is structurally weakness in the economy that can't be fixed in the short term. Real GDP per capita has been shrinking for eighth consecutive quarter, and household spending per capita has also been down for just as long. Most Canadian families continue to cut their discretionary spending, and not only on groceries, but even seeping into cutting their kids sports activities. Given the tough times most Canadians are facing now, I do believe there is light at the end of the tunnel. We are seeing the fixed rate have come down substantially in the last few weeks. For example, 3 year fixed mortgage rate was 4.99% in July. Now in September, it's around 4.49%. It may not be much, but these are steps in the right direction, given that only a year ago, the same rates were going as high as 5.7%. As the saying goes that lower rates usually means higher home prices. However, we are still not seeing that materialize at the moment. But when next Spring rolls around, it could be a whole different market. For the remaining of the year, I do believe prices will remain nearly flat, and that is highly dependent on the supply and overall inventory. Let's see.
Some of the unique trends I've been observing:
1. Canada's latest inflation is 2.5% in July (down -0.2% from previous month). As the inflation continue to ease (aka disinflation), the discussion now has shifted to recession. Even when the Canadian government denies that we are in a recession, but many Canadians (and the economic stats) indicates we have long been in one. If it weren't for the new immigrants propping up the Canadian economy, we would've been in much deeper water.
2. Latest unemployment rate came in at 6.6% (up +0.2% from previous month) and is entering into a alarming territory. If we hit do 7%, I think the Bank of Canada will be pressured to cut rates at a steeper pace. Meanwhile, younger Canadians continue to struggle to find jobs, where they compete with temporary visitors with working permit.
3. Speaking of temporary visitors with working permit, the Canadian government has officially axed the program two weeks ago. As reported earlier, this program was highly outdated (think labour shortage back in 2022) and was being abused by big corporations such as Tim Hortons. As we gear towards an imminent election (which can be triggered anytime between now and October 2025), the Trudeau's government has finally caved into the public uproar, albeit it's a bit too late.
4. The Vancouver real estate in August has been dismal, with sales plummeting -26% below 10 year average, and inventory and new supply coming in at +20.8% above the 10 year average. Needless the say, the candle is being burned on both ends. Even in the best case scenario, if the rate cuts were to suddenly materialize and the Buyers returned in droves, it will still take time for the current over-supply to digest and normalize. Like the saying "a cruise ship takes time to turn", so does the market takes time to normalize.
5. The B.C fiscal year ends with a forecasting a provincial budget deficit of $8.979 billion (+$1.1 billion from previous year), as the provincial economic situation worsens. If the projection is correct, that would be the largest deficit in BC history. Again, politicians blame lower corporate tax revenue and wildfires. How is no one responsible for reckless spending by running a disastrous deficit? If I were to run a private company with a monstrous deficit, I would definitely be on the chopping block. Also, I thought we had more taxes this year than last?
6. In a rather interesting turn of events, the Toronto real estate board has reported that for the first time since 2016, there were fewer real estate agents year-over-year (annual decline of -1,363 less agents). That is somewhat understandable as Toronto is the epicentre of the Canadian real estate plunge. With sales dropping to decade low (less income), and homes taking longer to sell (increased workload with longer sales cycle), one can imagine that real estate agents are no longer perceived as an easy and glamorous profession.
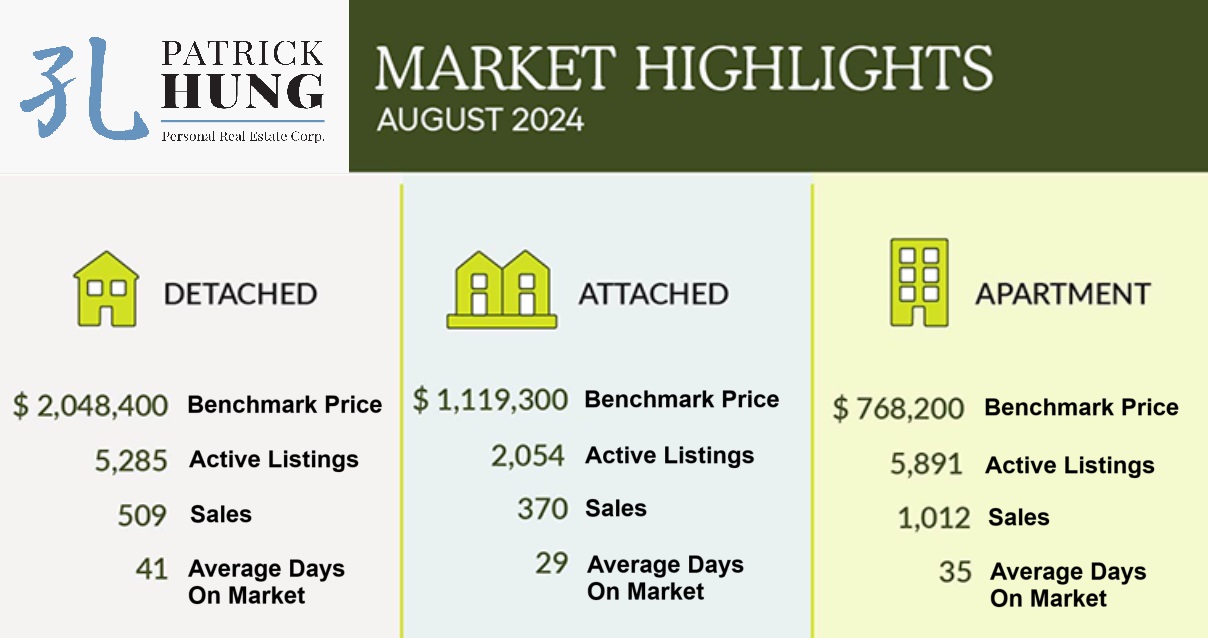
Here are the 3 highlights for August:
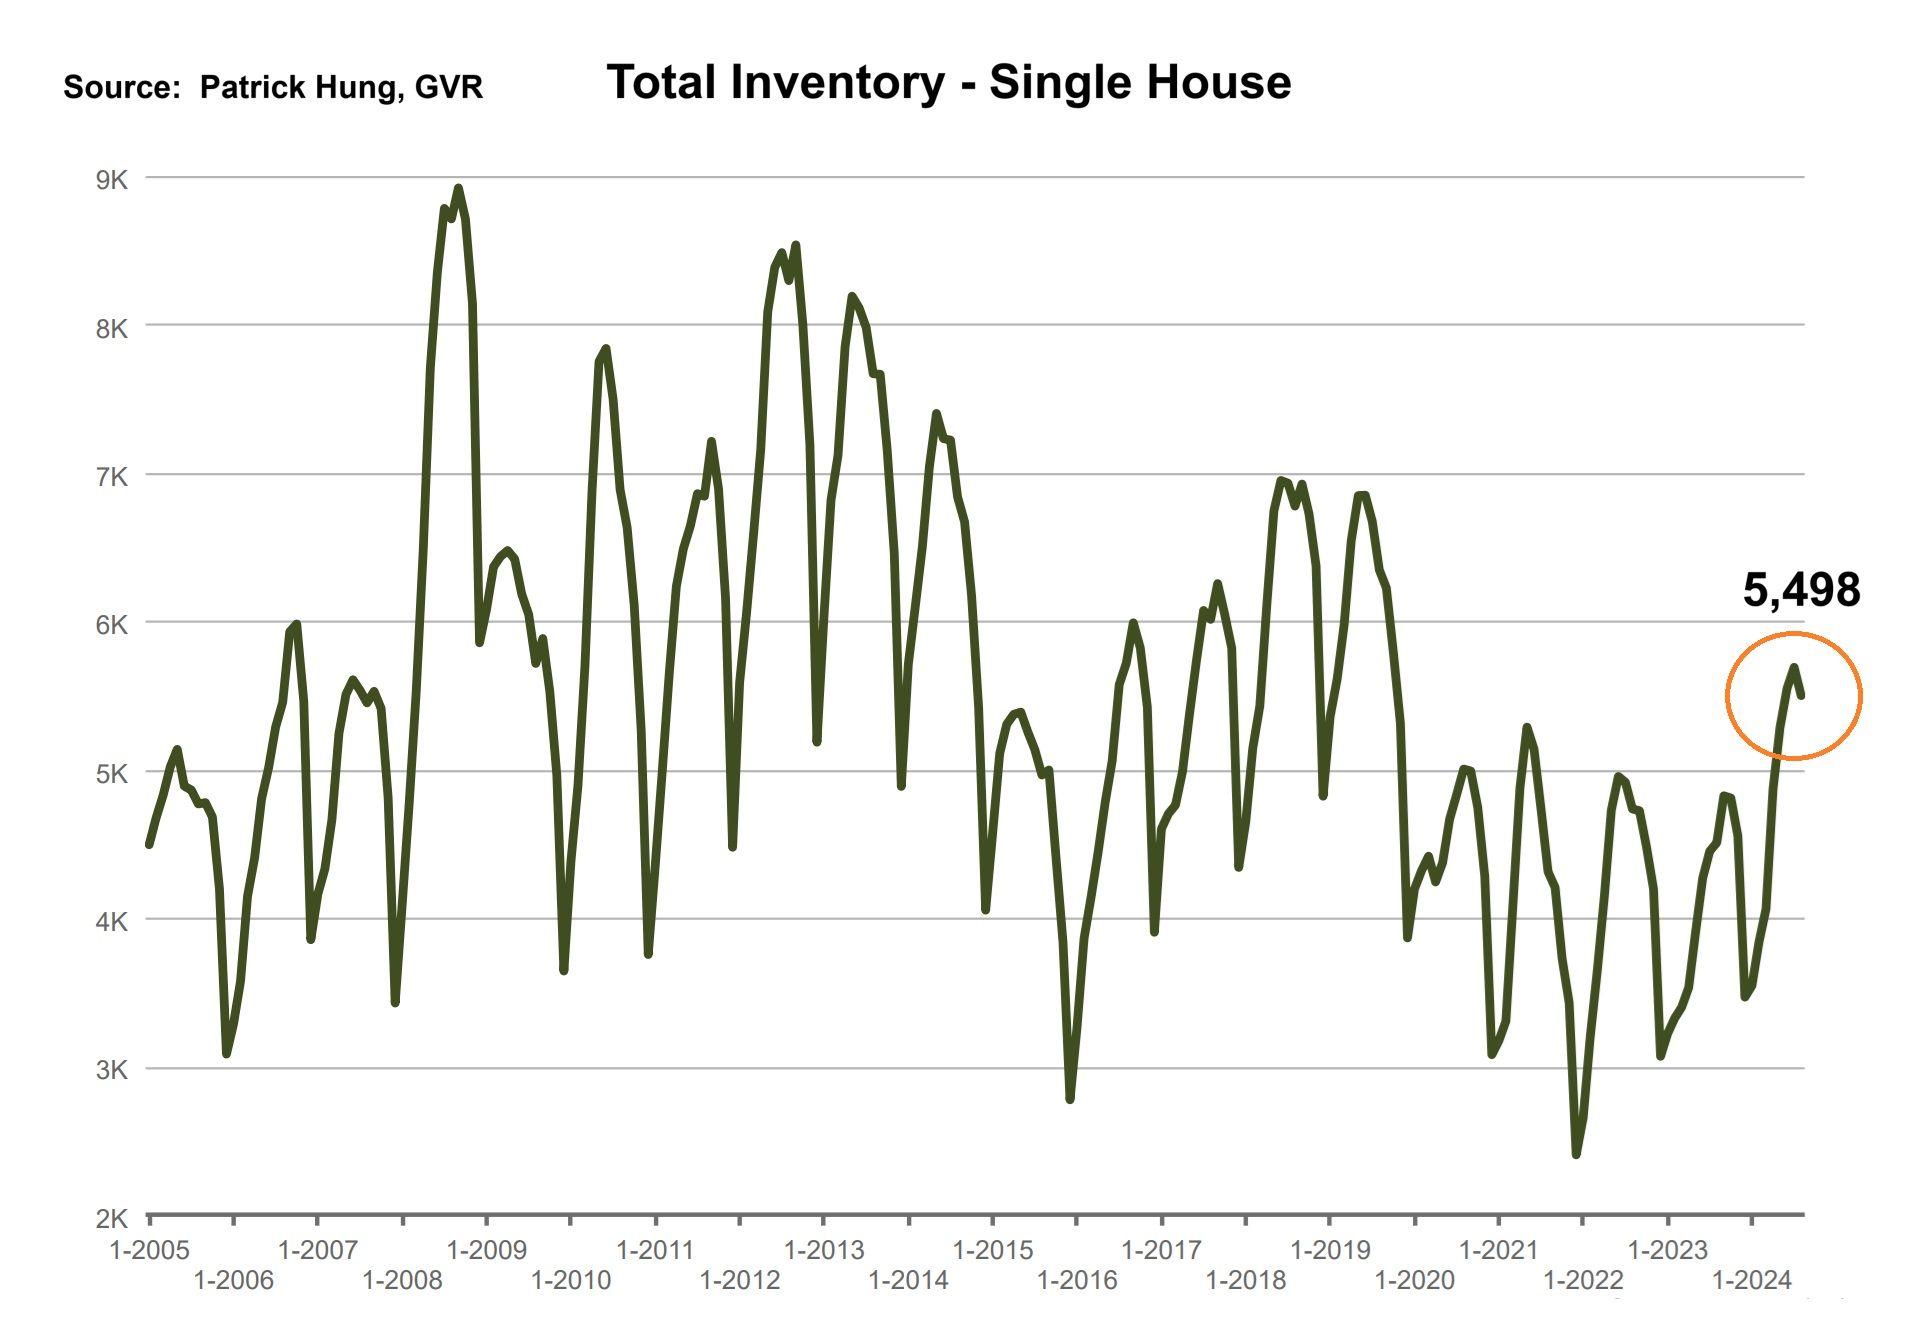
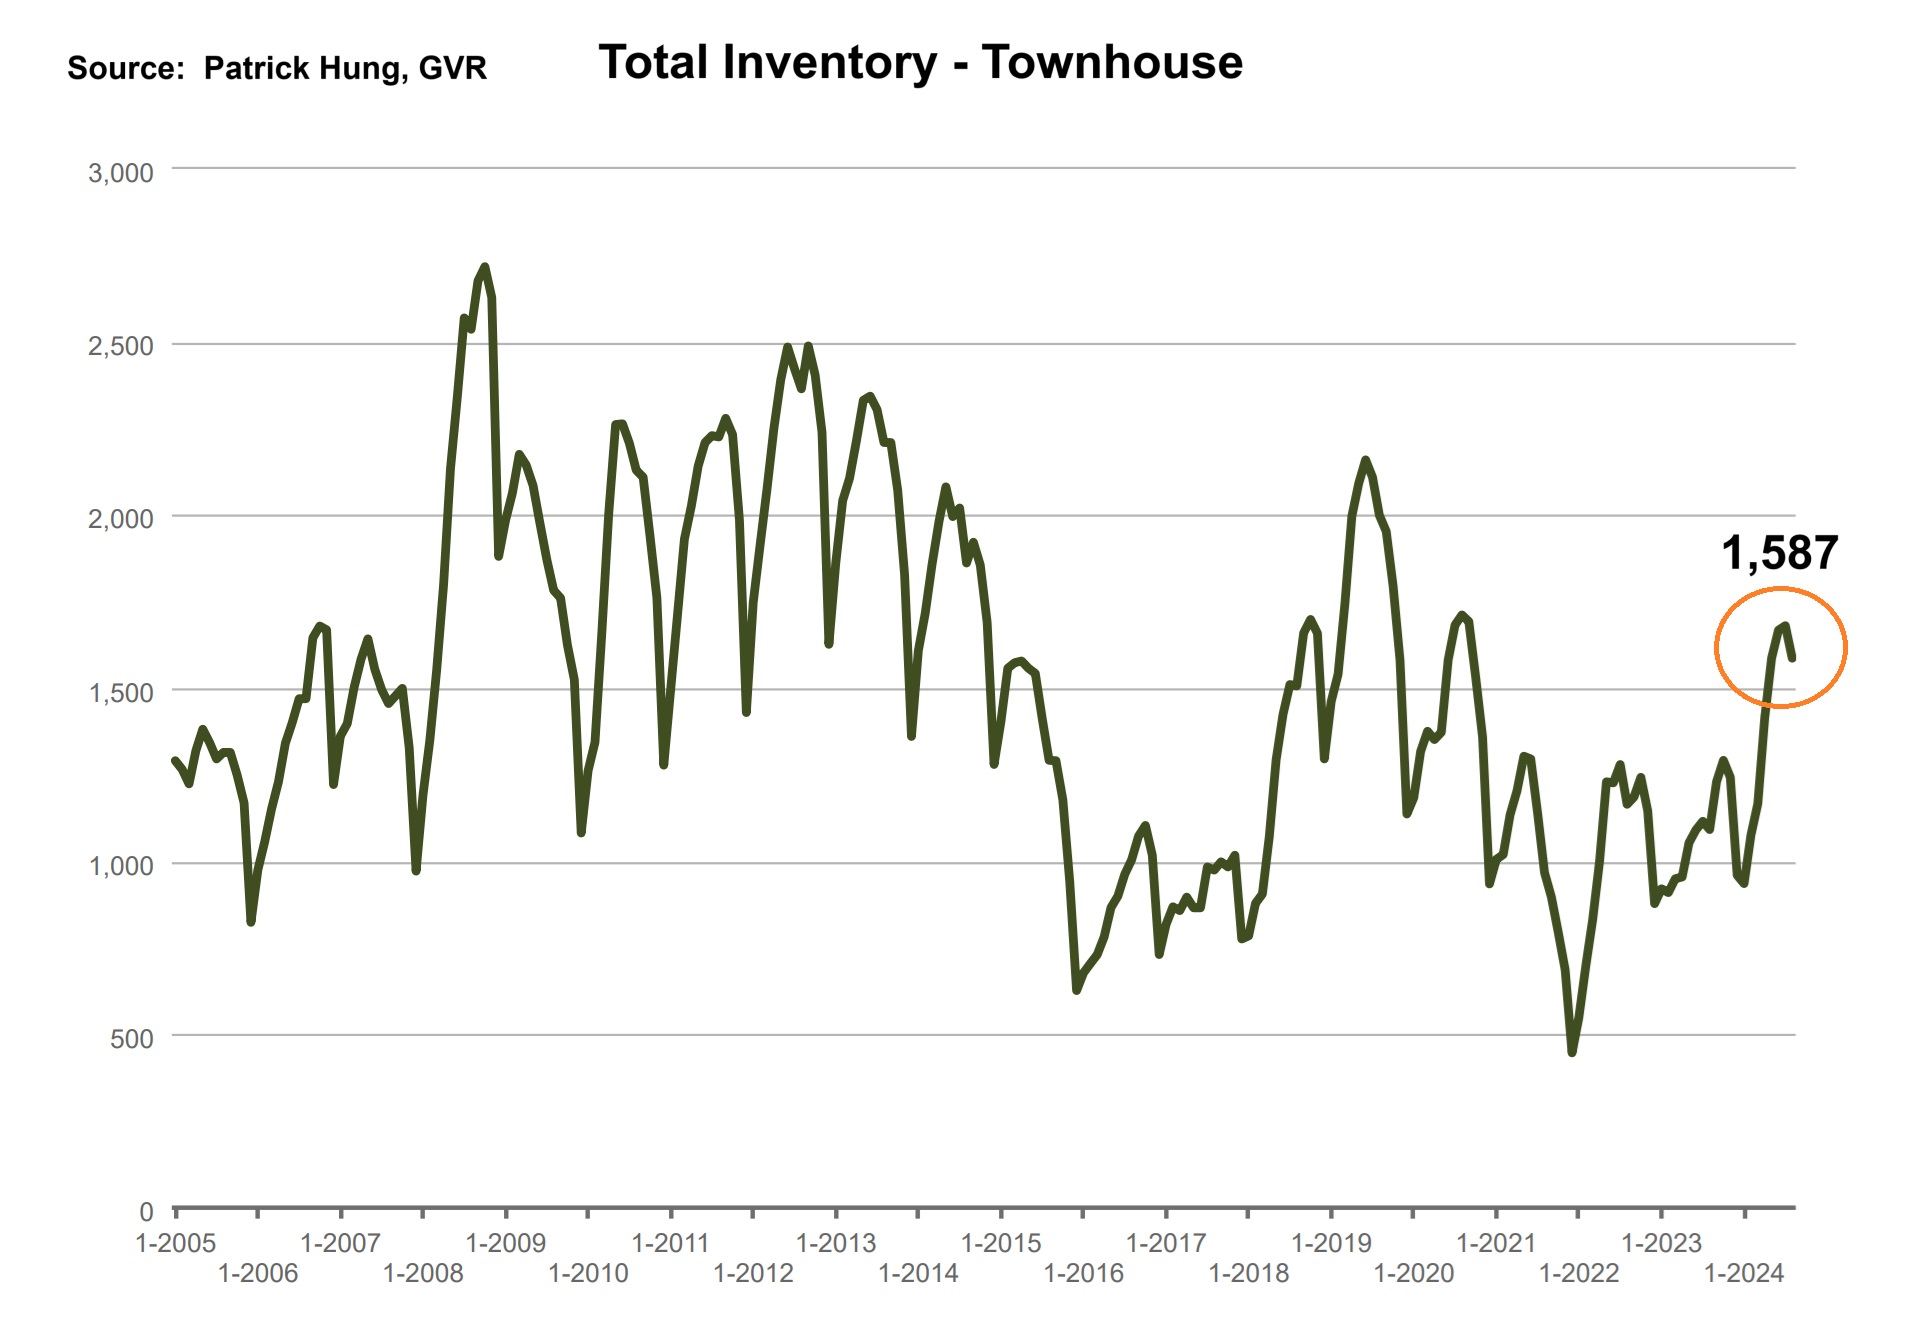
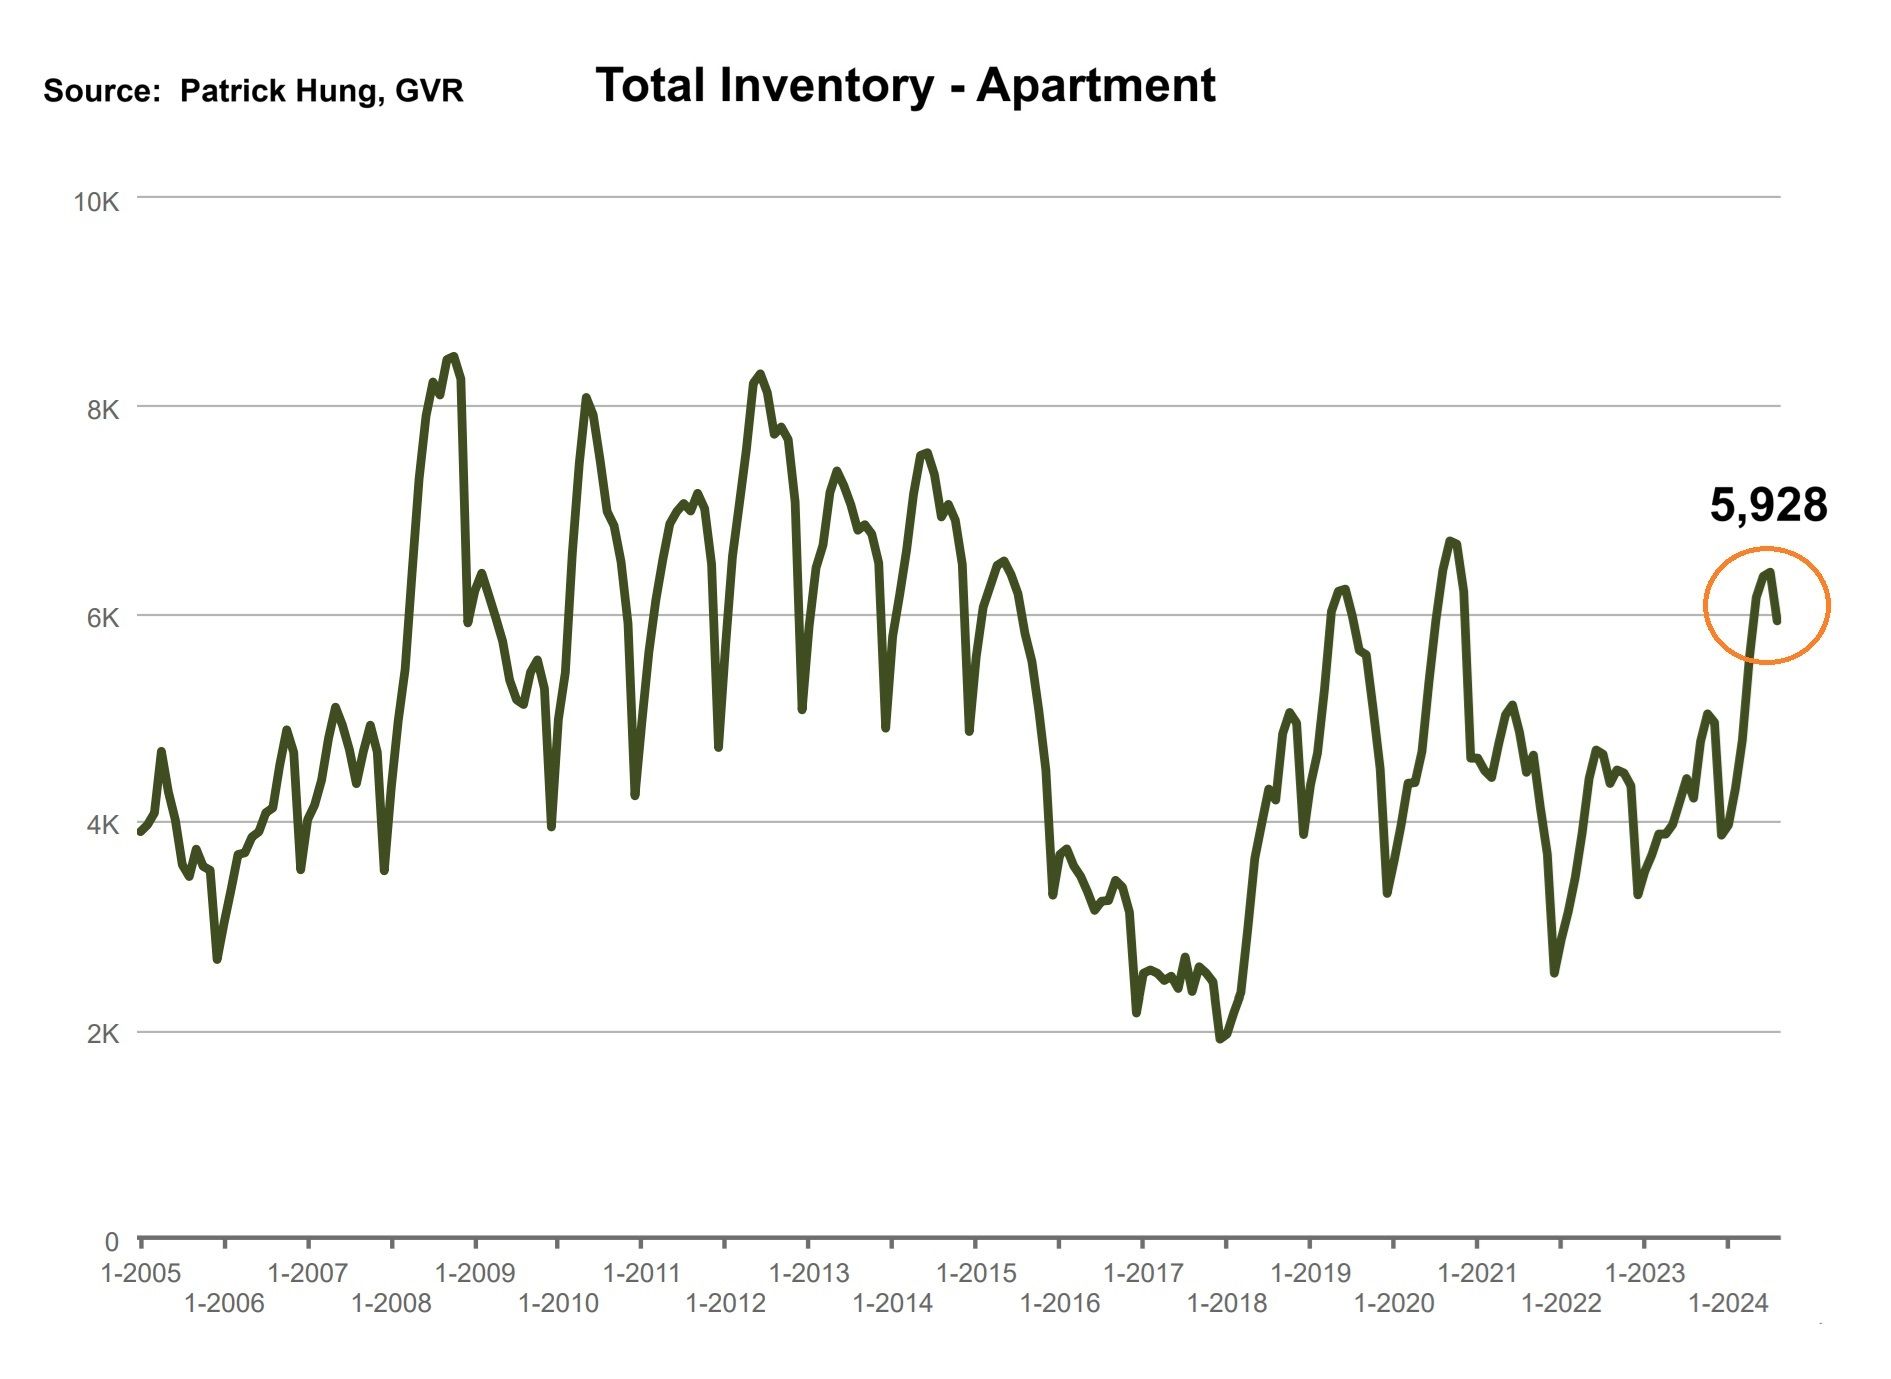
- Total inventory has dipped slightly but is still above 13,000 units. Last month was the first time since January that were was a month-over-month drop in total inventory.
- August sales of 1,896 units were dismal by all means and is the worst August since 2012.
- August home price remain nearly flat at -0.1% (July's price drop was -0.8%). September will be a key month of how the increased supply and demand play out.
Here are the in-depth statistics of the August:
- Last month's sales were -26% below the 10 year August's sales average.
- Month by month residential home sales dropped by -22.6% from July 2024.
- Month by month new home listings decreased by -35.7% compared to July 2024.
- Last month's price dropped was -0.1% from to July 2024. (compared to -0.8% from June-July)
- Sales-to-listing (or % of homes sold) ratio is 14.3% (compared 16.9% in July 2024). By property type, the ratio is 9.6% for single houses, 18% for townhouses, and 17.2% for apartments/condos.
Download August 2024 Greater Vancouver Real Estate Report
Single House Market
For the month of August, the neighorhoods that registered most price growth are Burnaby, New Westminster and West Vancouver, at +3.2%, +2.2% and +1.6% respectively. Conversely, the neighborhoods registered the most significant price drops are all in the outskirts, at Bowen Island, Vancouver West, and Burnaby North, with -4.4%, -1.4% and -1.2% respectively. The detached home market has officially shifted into a Buyer's market, with average days on market further climbing to 41 days (compared to 37 days last month), and month-to-month average price remained nearly flat at -0.1% (compared to -0.6% in June). Sales-to-listing ratio (% of homes sold) slipped further to 9.6%. (compared to 12.8% last month).
Townhouse Market
In August, the areas with the most townhouse price growths were Sunshine Coast, Squamish, and registering +1.7%, +1.2% and +1% respectively. Conversely, the neighborhoods with the negative price growth are Burnaby South, Burnaby East and North Vancouver, at -3.5% and -3.2% (tied of 2nd and 3rd) respectively. The townhouse market has finally entered the balanced market, with average days on market climbing significantly to 29 days (compared to 26 days last month). Month-to-month sale price dipped further by -1.2% (compared to -0.6% last month). Sale-to-listing (% homes sold) ratio remain the best among all segments but dropped slightly to 18% (compared to 20.1% last month).
Apartment and Condo Market
The apartment market is becoming relatively unpredictable compared to other segments. Why? On one end, last month's price was literally flat at 0%, and with interest rate continue to trend downwards, it's feels like there should be more first time home buyer, correct? Well, that hasn't been the case in the past few months. In September, I expect the apartment scene to see the highest activity surge, but at the same time matched by a tide wave of new supply. In nature, the apartment market is especially sensitive the oversupply, where a Buyer can find many identical units within the same area. Thus, in the current apartment market, the decision is much more logical than emotional for Buyers. On the other end of the apartment spectrum, we see investors still treading very cautiously: the formula to generate positive cash flow is still not there yet. Thus, unless we see the first time home buyers really stepping back into the apartment market, I do believe the supply would eclipse the demand and more softness (and downward price pressure) would remain for the rest of the year.
For the month of August, the best performing neighbourhoods for apartments are Richmond, New Westminster and Burnaby South, posting +1.6% and +0.8% (tied 2nd and 3rd) respectively. Conversely, the areas with the most significant price drops were all in the outskirts in Squamish, Sunshine Coast and Whistler, with -7.9%, -7.5% and -6.8% respectively. The apartment and condo segment have finally entered a balanced market, with average days further climbing to 35 days (compared to 29 days last month). Month-to-month sale price growth remained flat at -0% (compared to -0.7% last month). Sale-to-listing (% homes sold) ratio remained dipped slightly to 17.2% (compared to 19.3% last month).
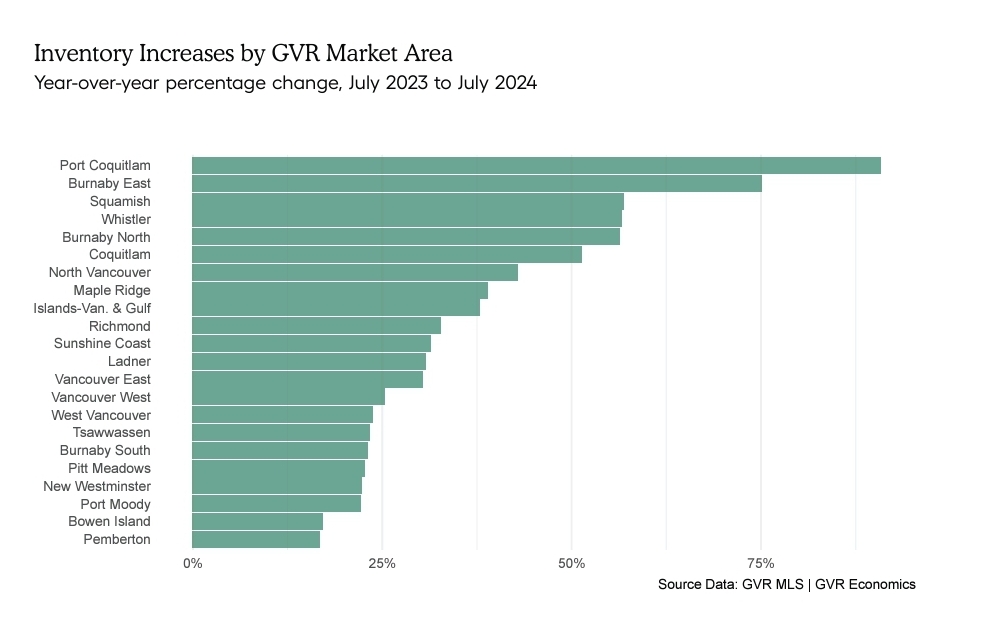
1. Hello Supply, My Old Friend
The Greater Vancouver market has long been an under-supplied market. But not this year. The flood of inventory coming onto the market is matching decade highs, and thus driving some markets from Sellers market in Spring, to Balanced or even Buyers in the Summer. Port Coquitlam has seen as much as 80% inventory growth year-over-year. Downward price pressure will be high in these neigborhoods, at least in the the near future. (Source: GVR MLS & Economics)
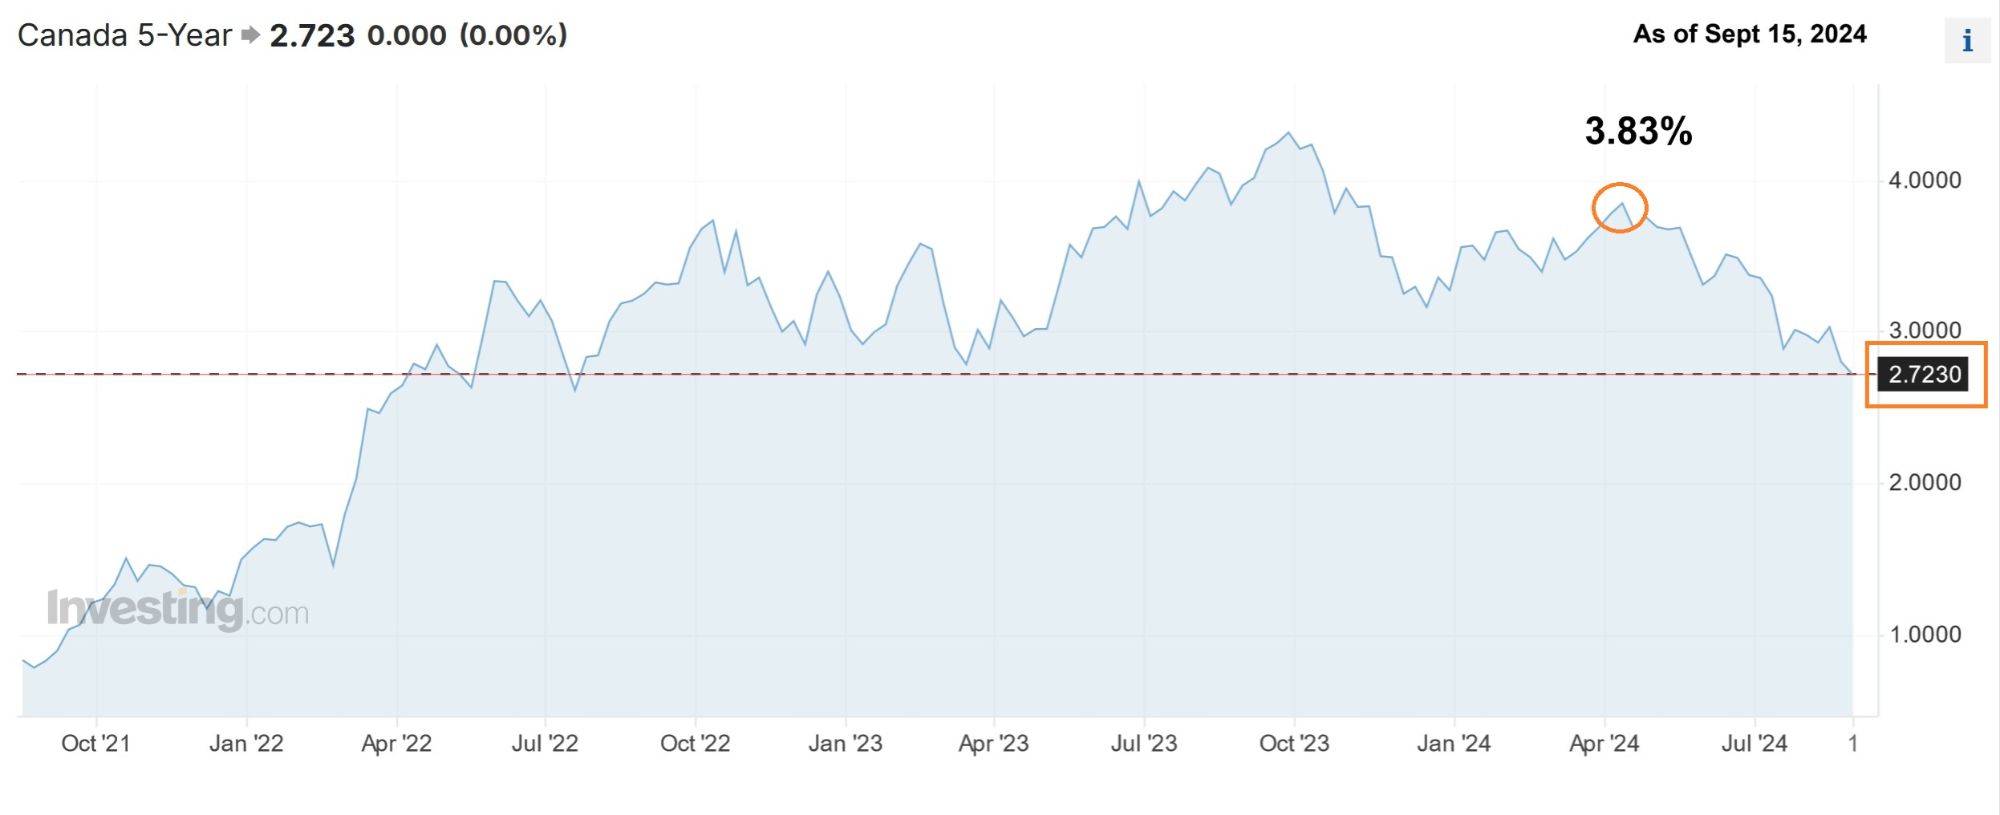
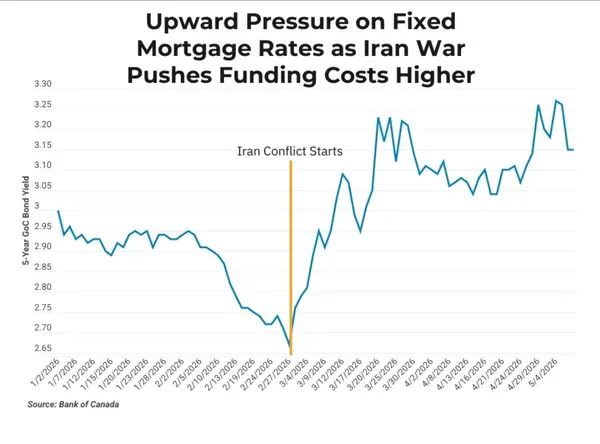
Since April of this year, the 5 year Canadian bond yield (which affects the 5 year mortgage rates) has been dropping steadily. As of Sept 15, it is sitting -1.1% lower than 5 months ago. As major bank continue to lower their rates, there is a sense of relief for home owners who are about to renew their mortgages soon. There is no doubt that there is weakness in the Canadian economy, but there is light at the end of the tunnel. (Source: Investing.com)
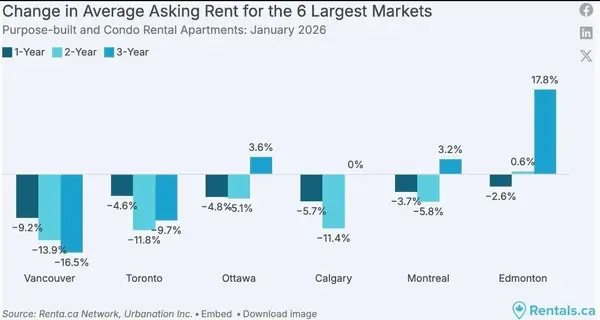
3. Unemployment vs. Rent
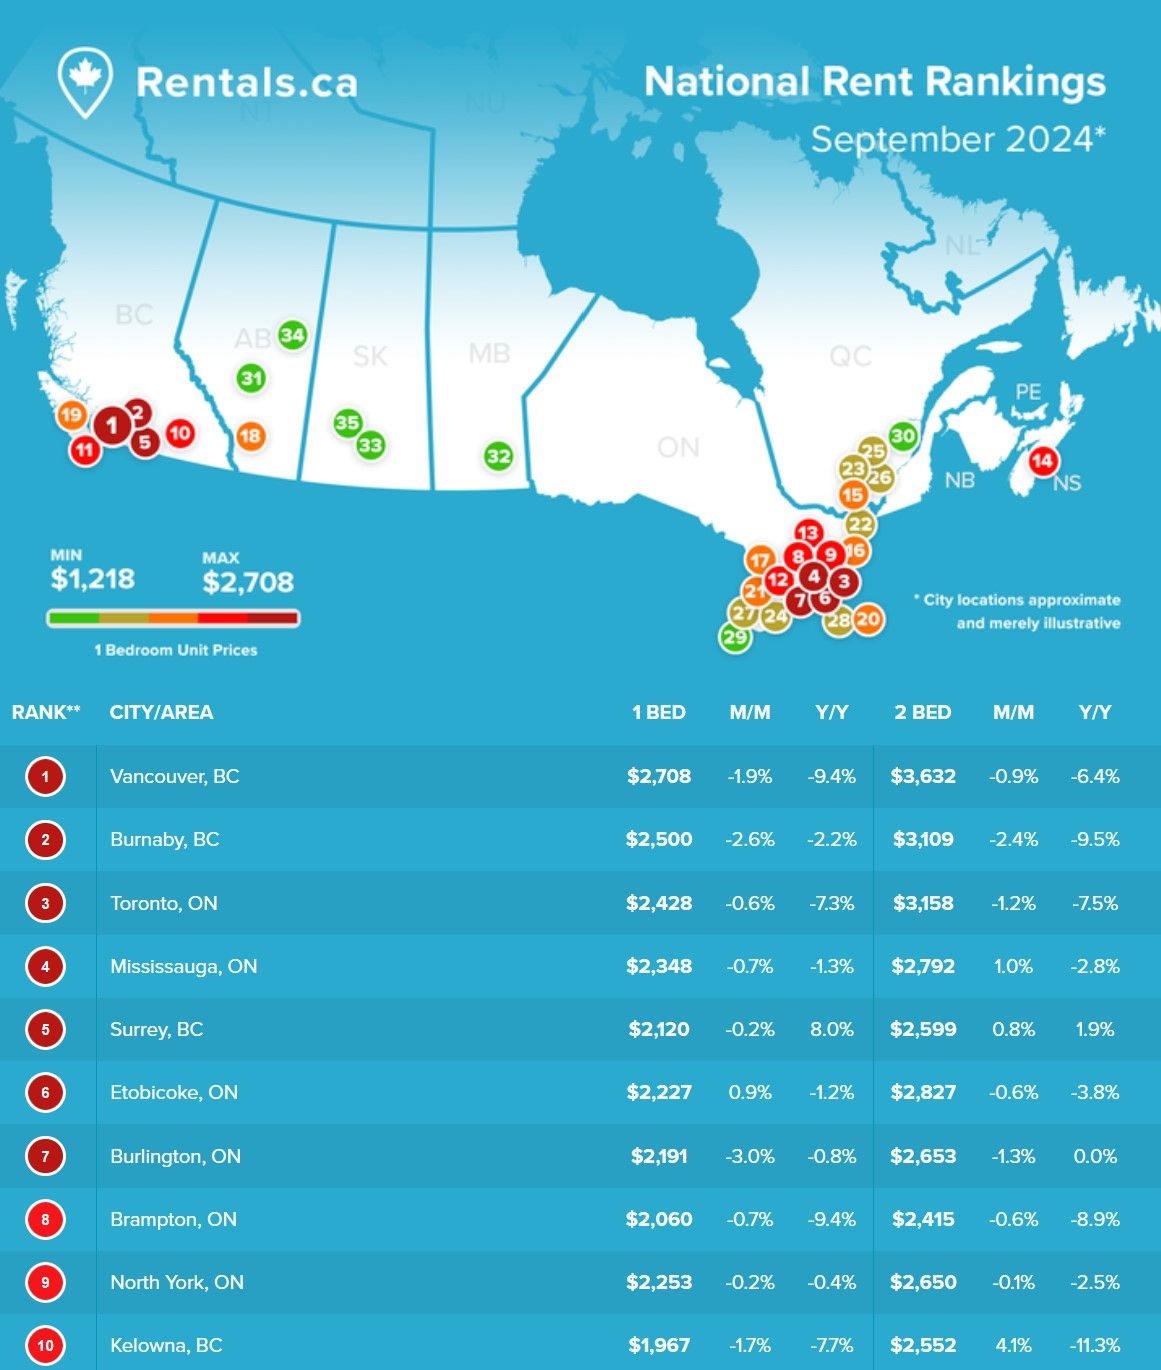
Even when there are signs of relief on the mortgage front, the investors are just not getting any slack. As Vancouver rental rates have dropped -9.4% year-over-year, this lower rents means further negative cash flow for some investors. But, lower rents surely doesn't make sense as immigrants are at a record level, right? Well, the rent drop has more to do with the unemployment rate. If an employee gets a raise, then they may choose to live better. On the other hand, if they got laid off, then they may have to move back in with their parents' home, or move in a smaller unit with a roommate. Noteworthy is that Surrey (rank no.5) was the out-liner, with a +8% rent increase. (Source: Rentals.ca)
Recent Posts


GET MORE INFORMATION