Real Estate Market Intelligence August 2024

Real Estate Market Intelligence August 2024
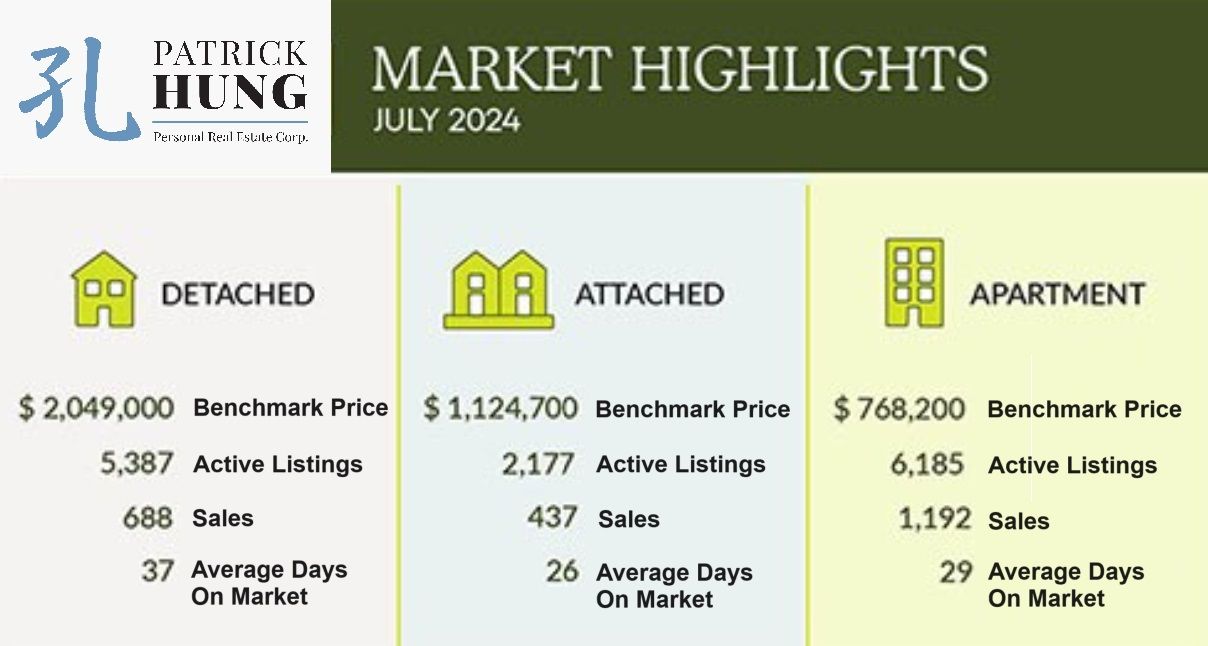
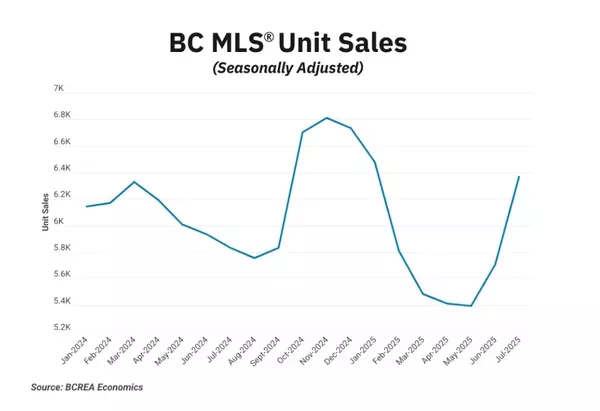
Just like that, summer have passed the midway point, and July was another month of polarity in the Vancouver real estate market, which continues to get stretched on both ends: more supply and less sales. As more new listings pile on to levels not seen since 2019, total inventory are now tipping back into the balanced market. Some segments, like apartments, are really seeing competition going on full swing. Last month's total supply is +12.7% above the 10 year average. On the other hand, demand remain relatively weak and sales are -17.6% below the 10 year average. When combining the difference between the two, we are seeing an astonishing 30.3% gap. With more rate cuts on the horizon, the key difference between the Buyers and the Sellers are how they're interpreting the market in extremes. Buyers' logic are that with more rate drops on the way, they can save more money on mortgage payment if they delaying their purchasing plans. Conversely, Sellers see that rate cuts will mean home prices will bounce back, so they too are waiting. Both Buyers and Sellers are logically sound, but something's missing is the middle, which is somewhere in that 30.3% gap.
To make matters more complicated, the Canadian economic outlook has continue to deteriorate, and the latest unemployment rate (June) at 6.4% translates into 1.4 million people unemployed. Temporary overseas workers, which arrived through policies in 2022 during the labour shortage, have now effectively corroded the labour market. On the provincial level, the BC government has quickly back-paddled on their recent tenanted occupancy term for Buyers, going from 4 months previously to now 3 months. As explained before, Canadian major banks provide Buyers with pre-approved mortgage that need to complete in 3 months. The BC government's 4 month policy overreached that date, legitimately broke the timeline to purchase any tenanted properties. This latest mishap has proven once again that such top policy makers do not consult the industry before making decision: they simply shoot first and ask later. At times, it feels like all levels of government, federal, provincial and municipal, are all failing at their jobs at the same time.
As we move towards the latter half of the year, I believe the Vancouver real estate market will continue to experience further downward price pressure, which means it will only get worst before it gets better. Best case scenario is that the prices remain flat till end of year. Volatility in other markets (US and world stock market) along with heightened geopolitical tensions in the Middle East and Eastern Europe will like keep investors on their toes. Good news is that the US Feds has hinted their first rate cut may come as soon as September, and that should give the Bank of Canada more breathing room for more (and possibly stronger) rate cuts ahead. In the next few months though, expect more turbulence ahead. Buckle up.
Some of the unique trends I've been observing:
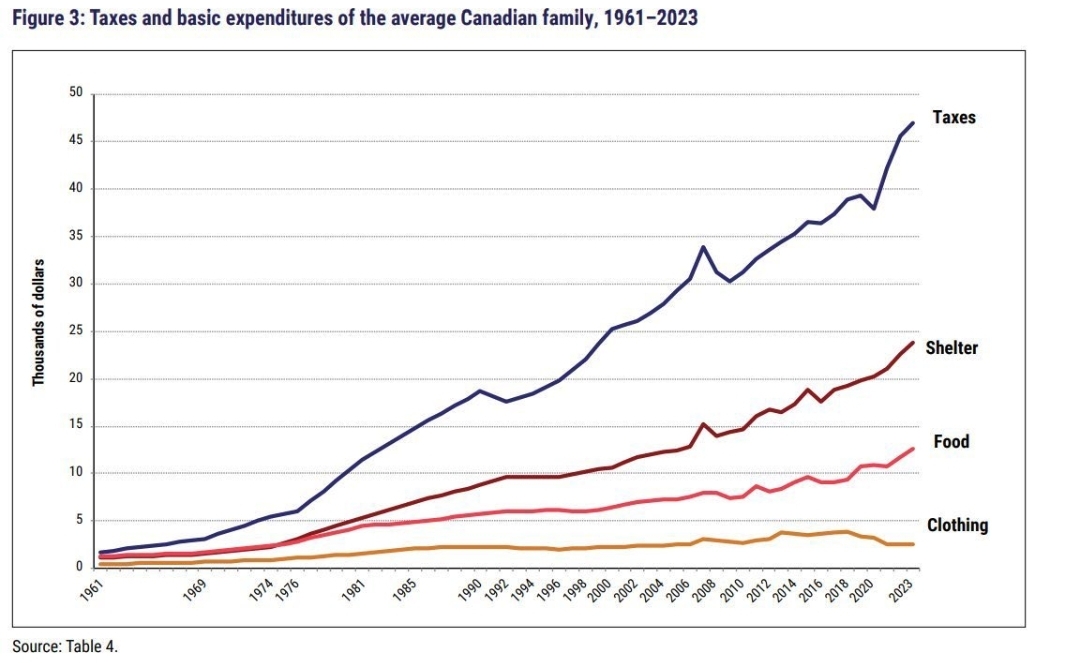
1. Canadians now are spending more on taxes than on basic necessities like food, housing and clothing combined. In 2023, average Canadian family with income of $109,235 paid $46,988 in taxes, representing 43% of their income. This is effectively one of, if not, the highest in any developed countries. If nothing is certain except death and taxes, then taxing us to death is the Canadian way to go.
2. The Vancouver real estate market in July continues to get stretched on both ends, with sales -17.6% below 10 year average, while total inventory has risen to +12.7% above the 10 year average. Unless something drastically happens, it will take a few months for the exist inventory to be digested. Overall market remain in a balanced market.
3. Canadian real estate investment remain weak, especially in big cities like Vancouver and Toronto. Higher interest rate, weak economy, and stagnating prices isn't an ideal investment environment. Many investors (such as condo or pre-sale Buyers) who made a purchase a few years back, continue to face negative cash flow on their property. All the risk is just isn't worth it for investors, who can elect to just put their money in 1 year GIC (Guaranteed Investment Certificate) around 4.5%, and have a better night sleep.
4. The Vancouver luxury market was once the darling of North America, but that has changed with activities dropping from January-June 2024. Residential home sales over $4 million fell by -16%, and sales of premium luxury properties over $10 million fell by a whooping -50%. Perhaps this has to do with the net loss of over 18,000 residents who migrate away from Vancouver? Whatever the reason is, the wealthy folks may no longer find Vancouver as attractive as it used to be.
5. BC government comically (and quickly) revised the BC tenancy policy after 30 days, with Buyer's wanting to occupy the home needing to provide a 3 months notice (previously 4 months). As most are aware that for a Buyer to wait 4 months is too long to wait, Canadian banks also won't allow such a long time frame of mortgage approvals to close. Now that the BC government has back-paddled on it, I wonder if these policy maker will continue to make decisions drawn on a back of a napkin?
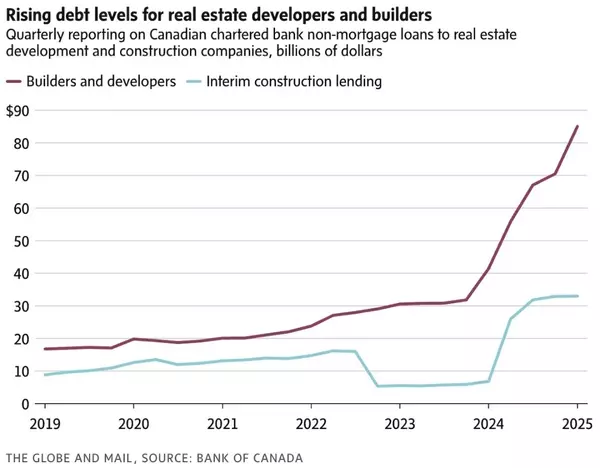
6. Canadian real estate insolvency is set to surpass levels of Global Financial Crisis back in 2019. There will be approximately 240 insolvencies in 2024, which is 57% higher than 2023, and 13% higher than 2019, when a swath of bad debt triggered the global recession. Perhaps this time is different than the previous ones, as the structural problem (higher building costs, taxes, and borrowing costs) are just too much for the developers to handle.
Here are the 3 highlights for July:
- Total inventory has remain elevated above 13,000 units, marking another highest supplied month of July since 2019.
- July sales of 2,325 units were mediocre by any means, but not the worst (compared to the recent low in July 2022 at 1,897 units)
- July continue another month of price drop of -0.8% (June's price drop was -0.4%). Negative price growth will likely continue in the near future as inventory accumulates.
Here are the in-depth statistics of the July:
- Last month's sales were -17.6% below the 10 year July's sales average.
- Month by month residential home sales dropped by -3.1% from June 2024.
- Month by month new home listings decreased by -2.6% compared to June 2024.
- Last month's price dropped -0.8% compared to June 2024. (compared to -0.4% in May 2024)
- Sales-to-listing (or % of homes sold) ratio is 16.9% (compared 17.6% in June 2024). By property type, the ratio is 12.8% for single houses, 20.1% for townhouses, and 19.3% for apartments/condos.
Download August 2024 Vancouver Real Estate Report
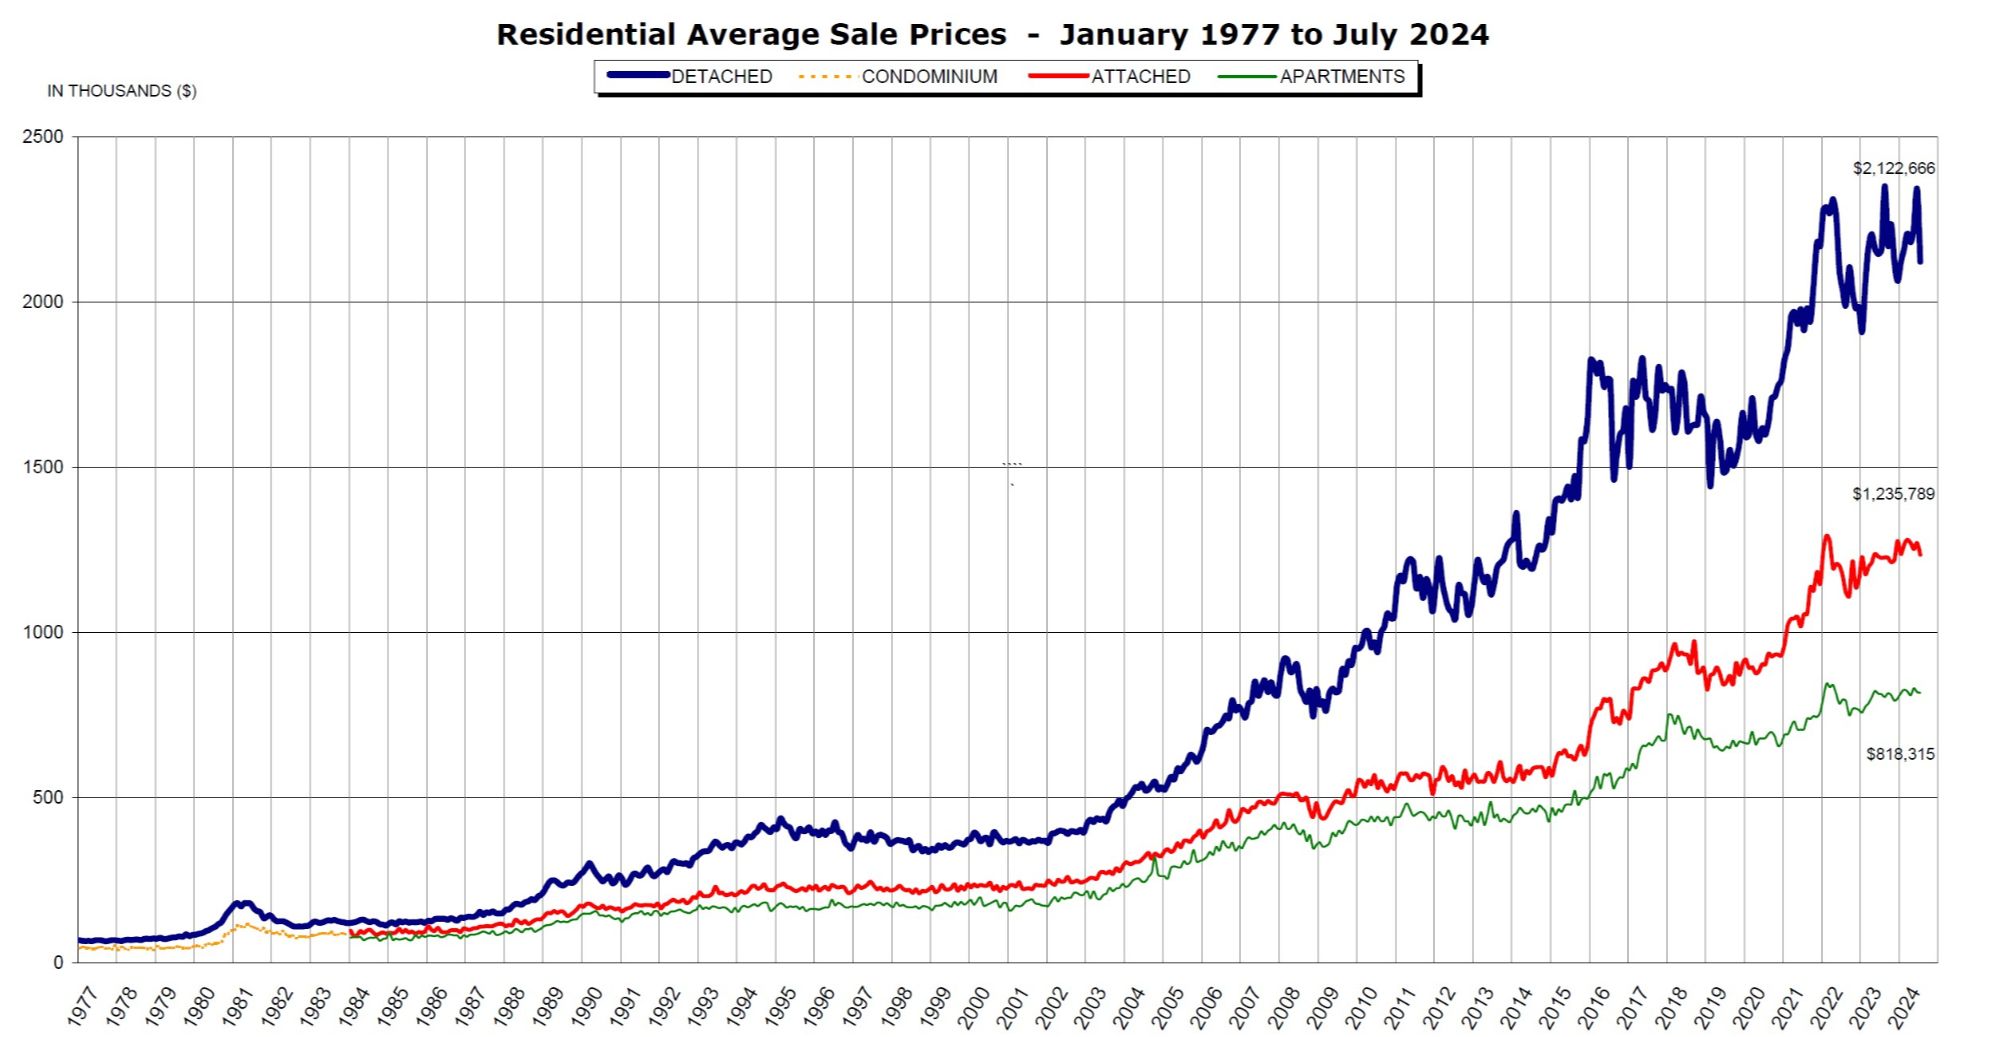
Single House Market
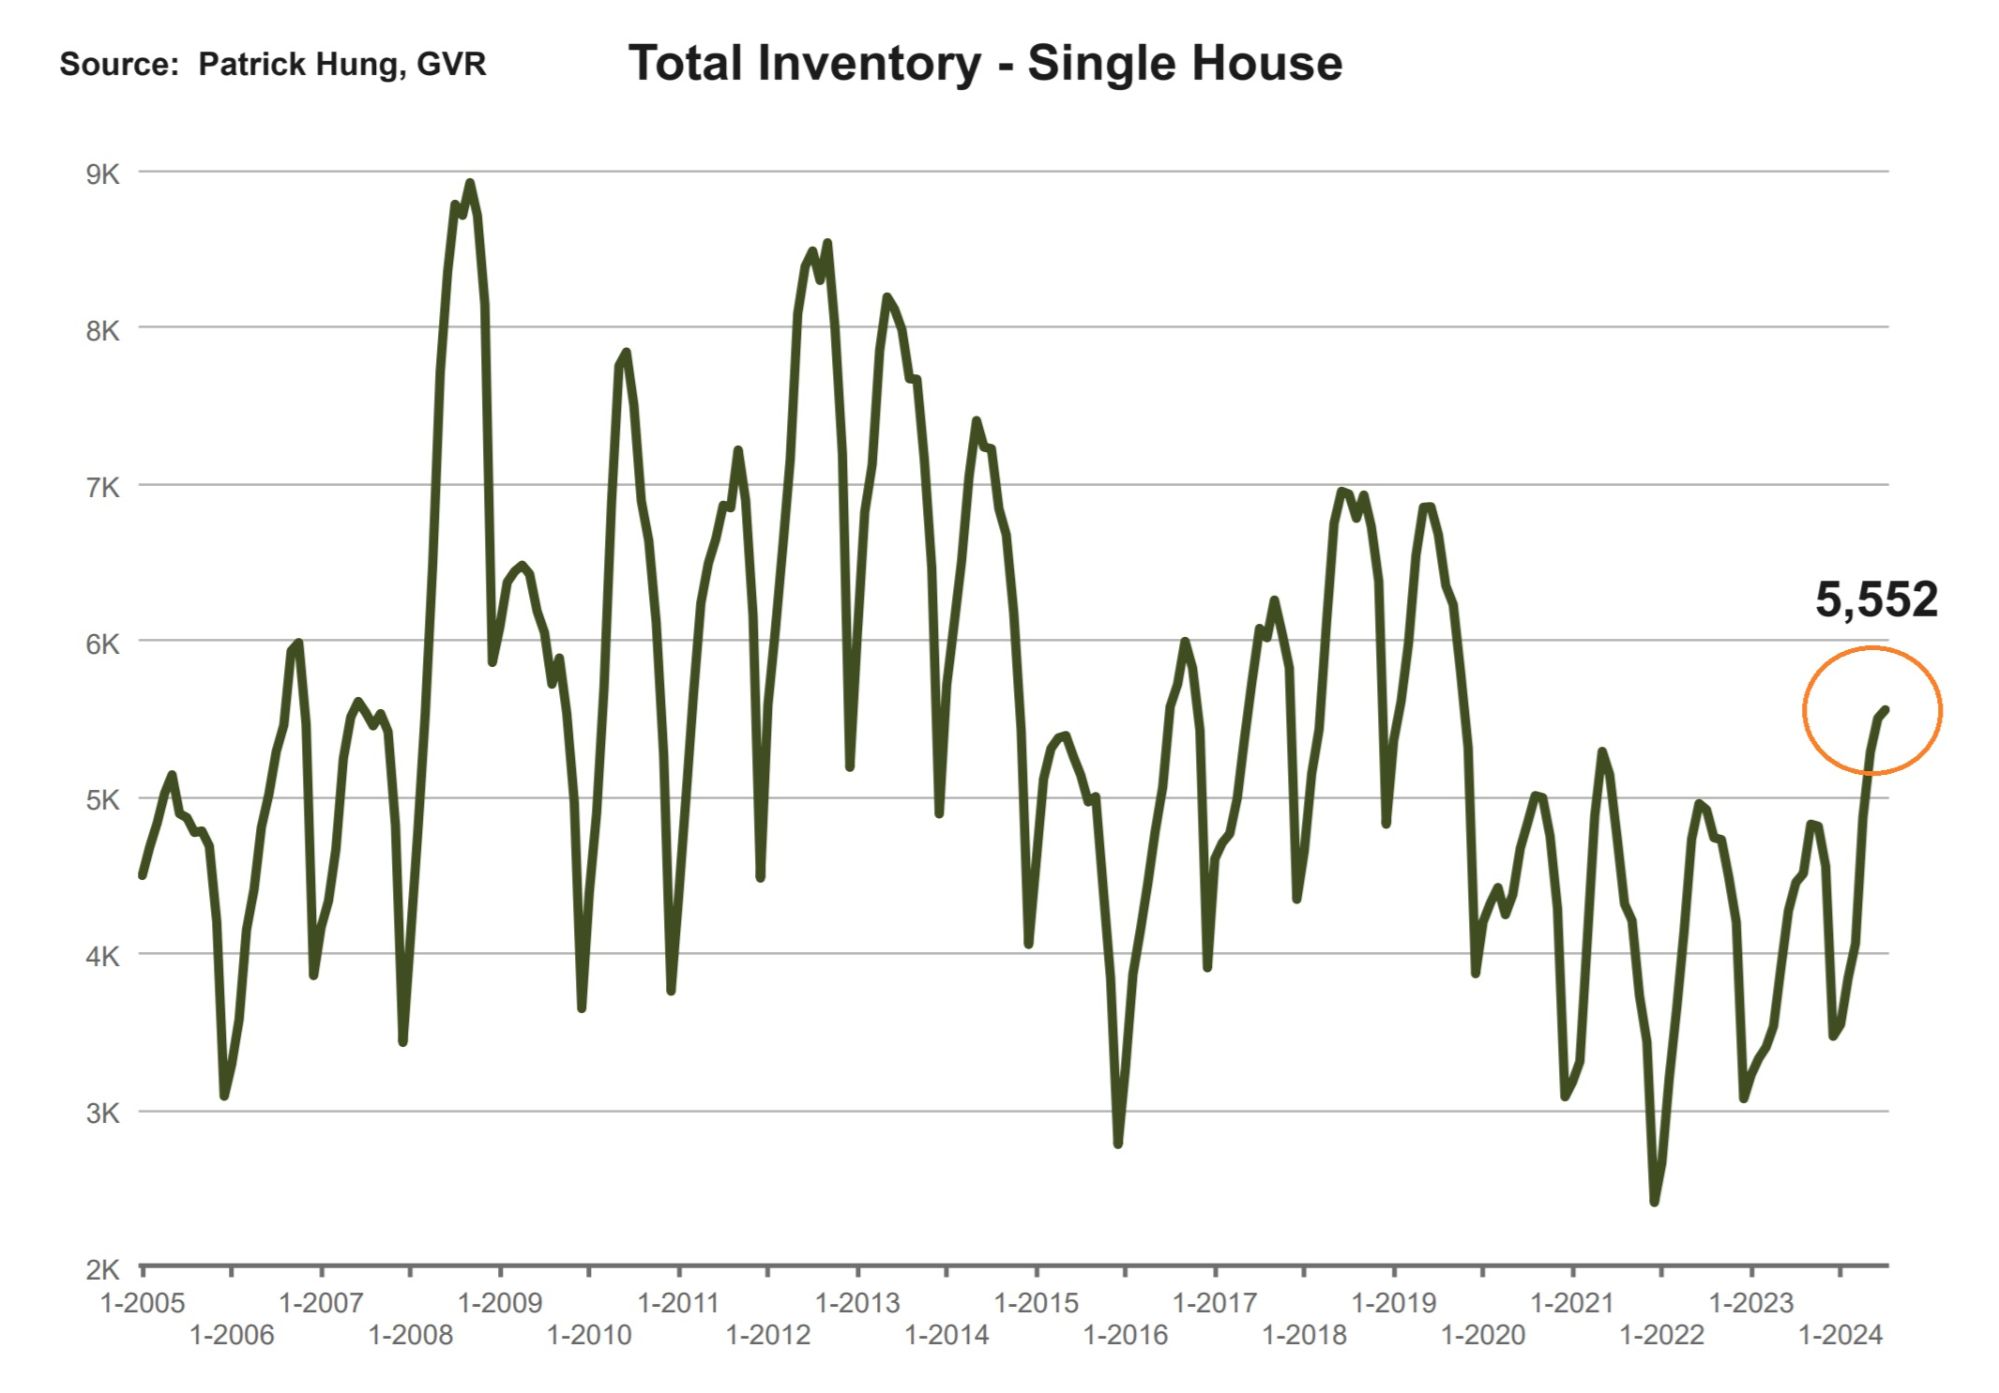
For the month of July, the neighorhood that registered most price growth are Tsawwassen, Port Coquitlam and Maple Ridge, at +1.4%, +0.9% and +0.5% respectively. Conversely, the neighborhoods registered the most significant price drops are all in the outskirts, at Bowen Island, Sunshine Coast and Whistler, with -5.3%, -3.9% and -1.9% respectively. The detached home market remains in a balanced market but is right at the borderline of a Buyer's market, with average days on market climbing to 37 days (compared to 31 days last month), and month-to-month average price remained nearly flat at -0.6% (compared to -0.1% in June). Sales-to-listing ratio (% of homes sold) slipped slightly to 12.8%. (compared to 13.1% last month).
Townhouse Market
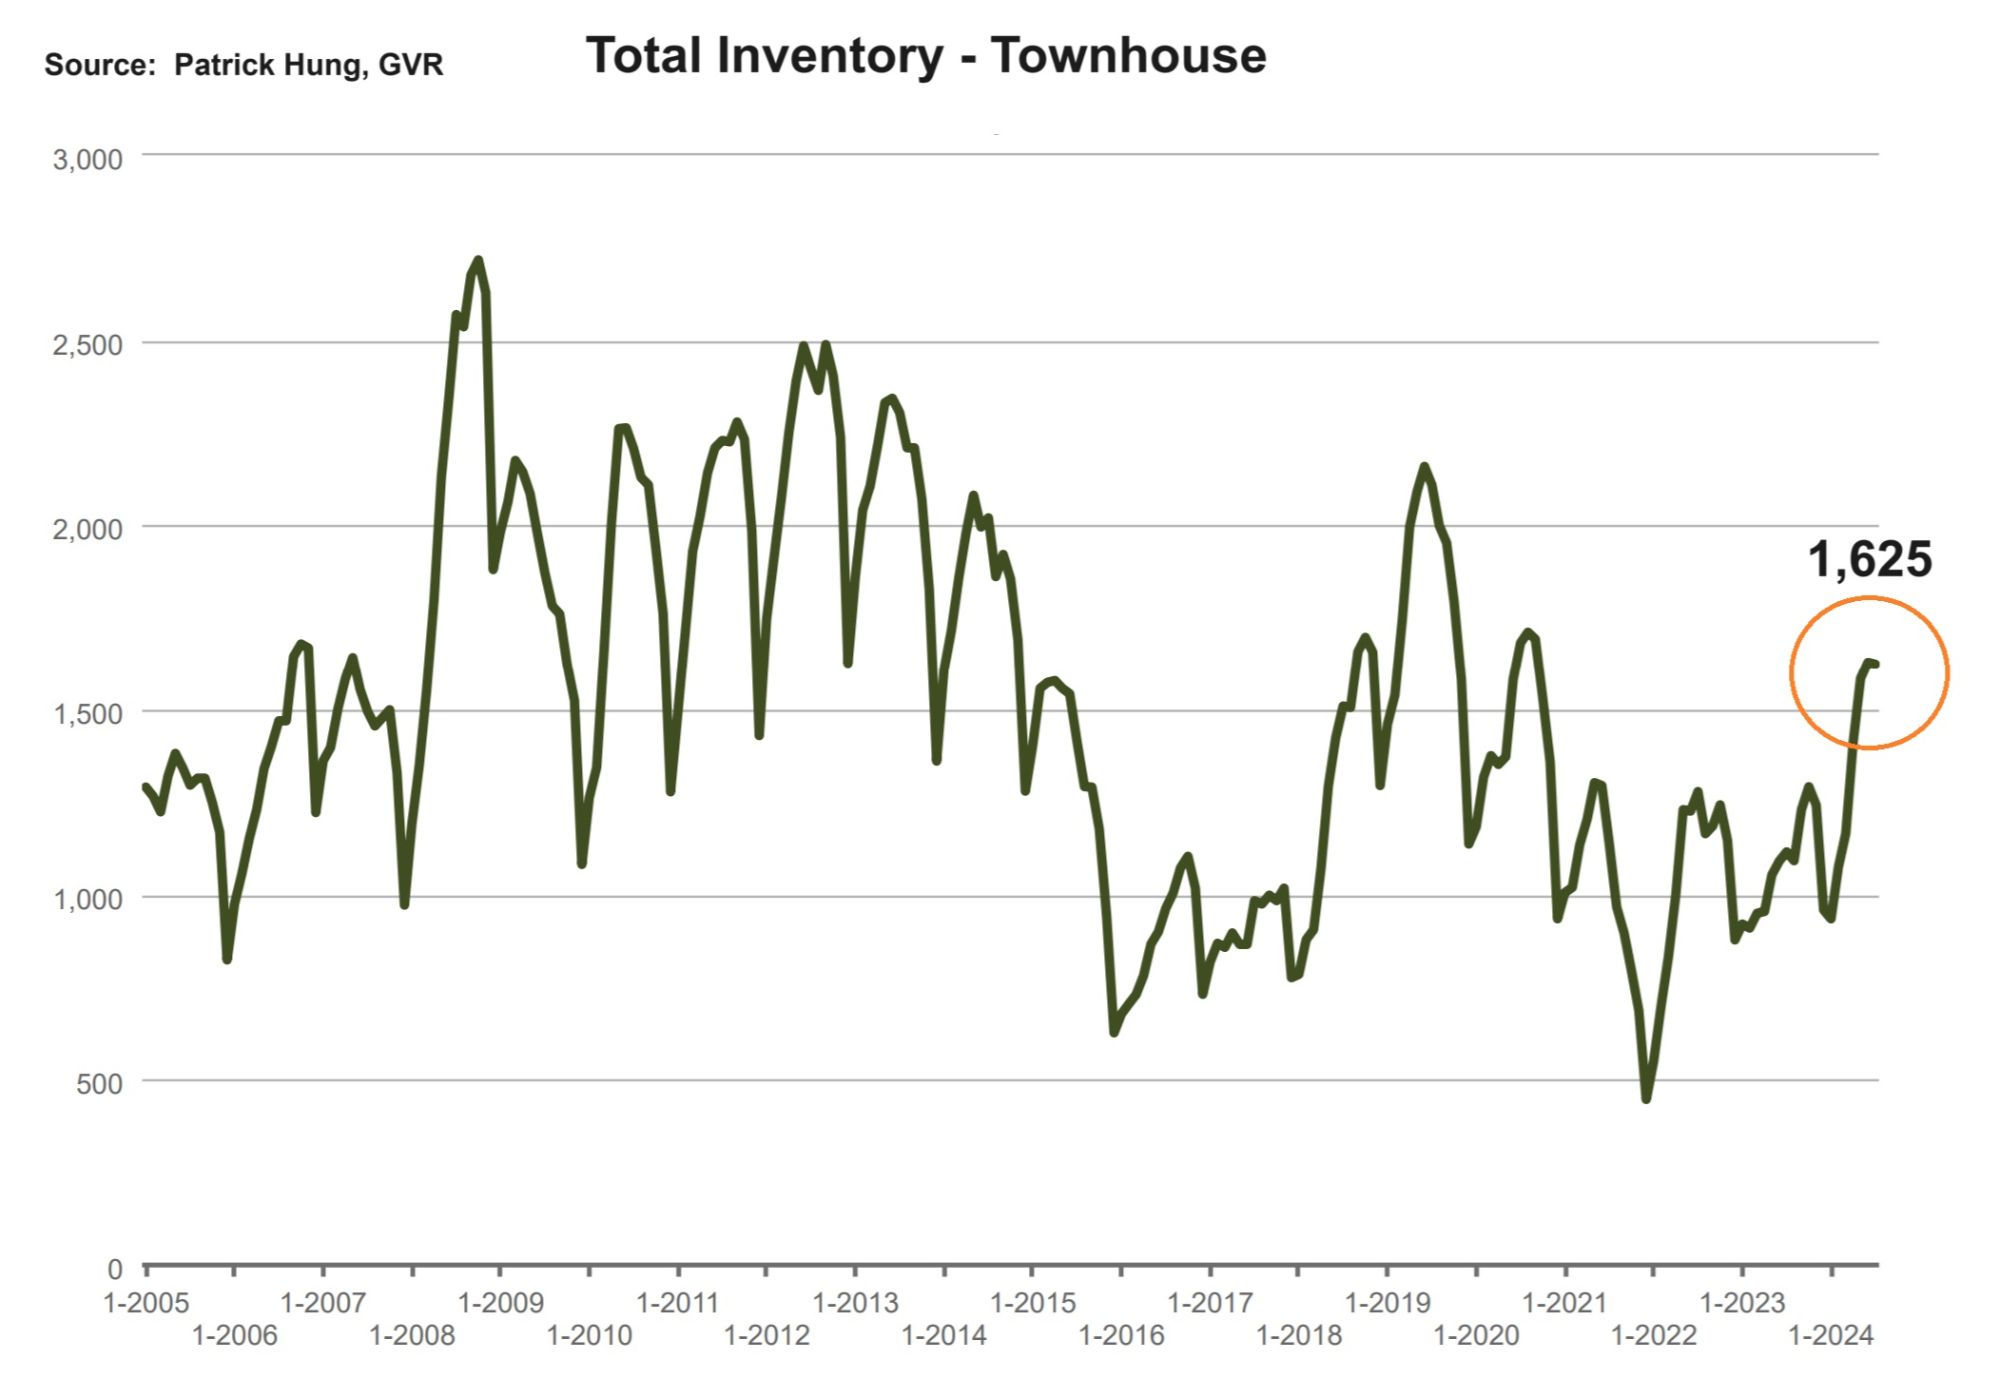
In July, the areas with the most townhouse price growths were Burnaby East, Port Moody and Tsawwassen, registering +1.7%, +1.2% and +1% respectively. Conversely, the neighborhoods with the least price growth are Whistler, Sunshine Coast and Vancouver West, at -3.5% and -3.2% (tied of 2nd and 3rd) respectively. The townhouse market has remains in the Seller's market but at the edge of a balanced market, with average days on market climbing significantly to 26 days (compared to 21 days last month). Month-to-month sale price dipped further by -1.2% (compared to -0.6% last month). Sale-to-listing (% homes sold) ratio remain the best among all segments but dropped to 20.1% (compared to 21.1% last month).
Apartment and Condo Market
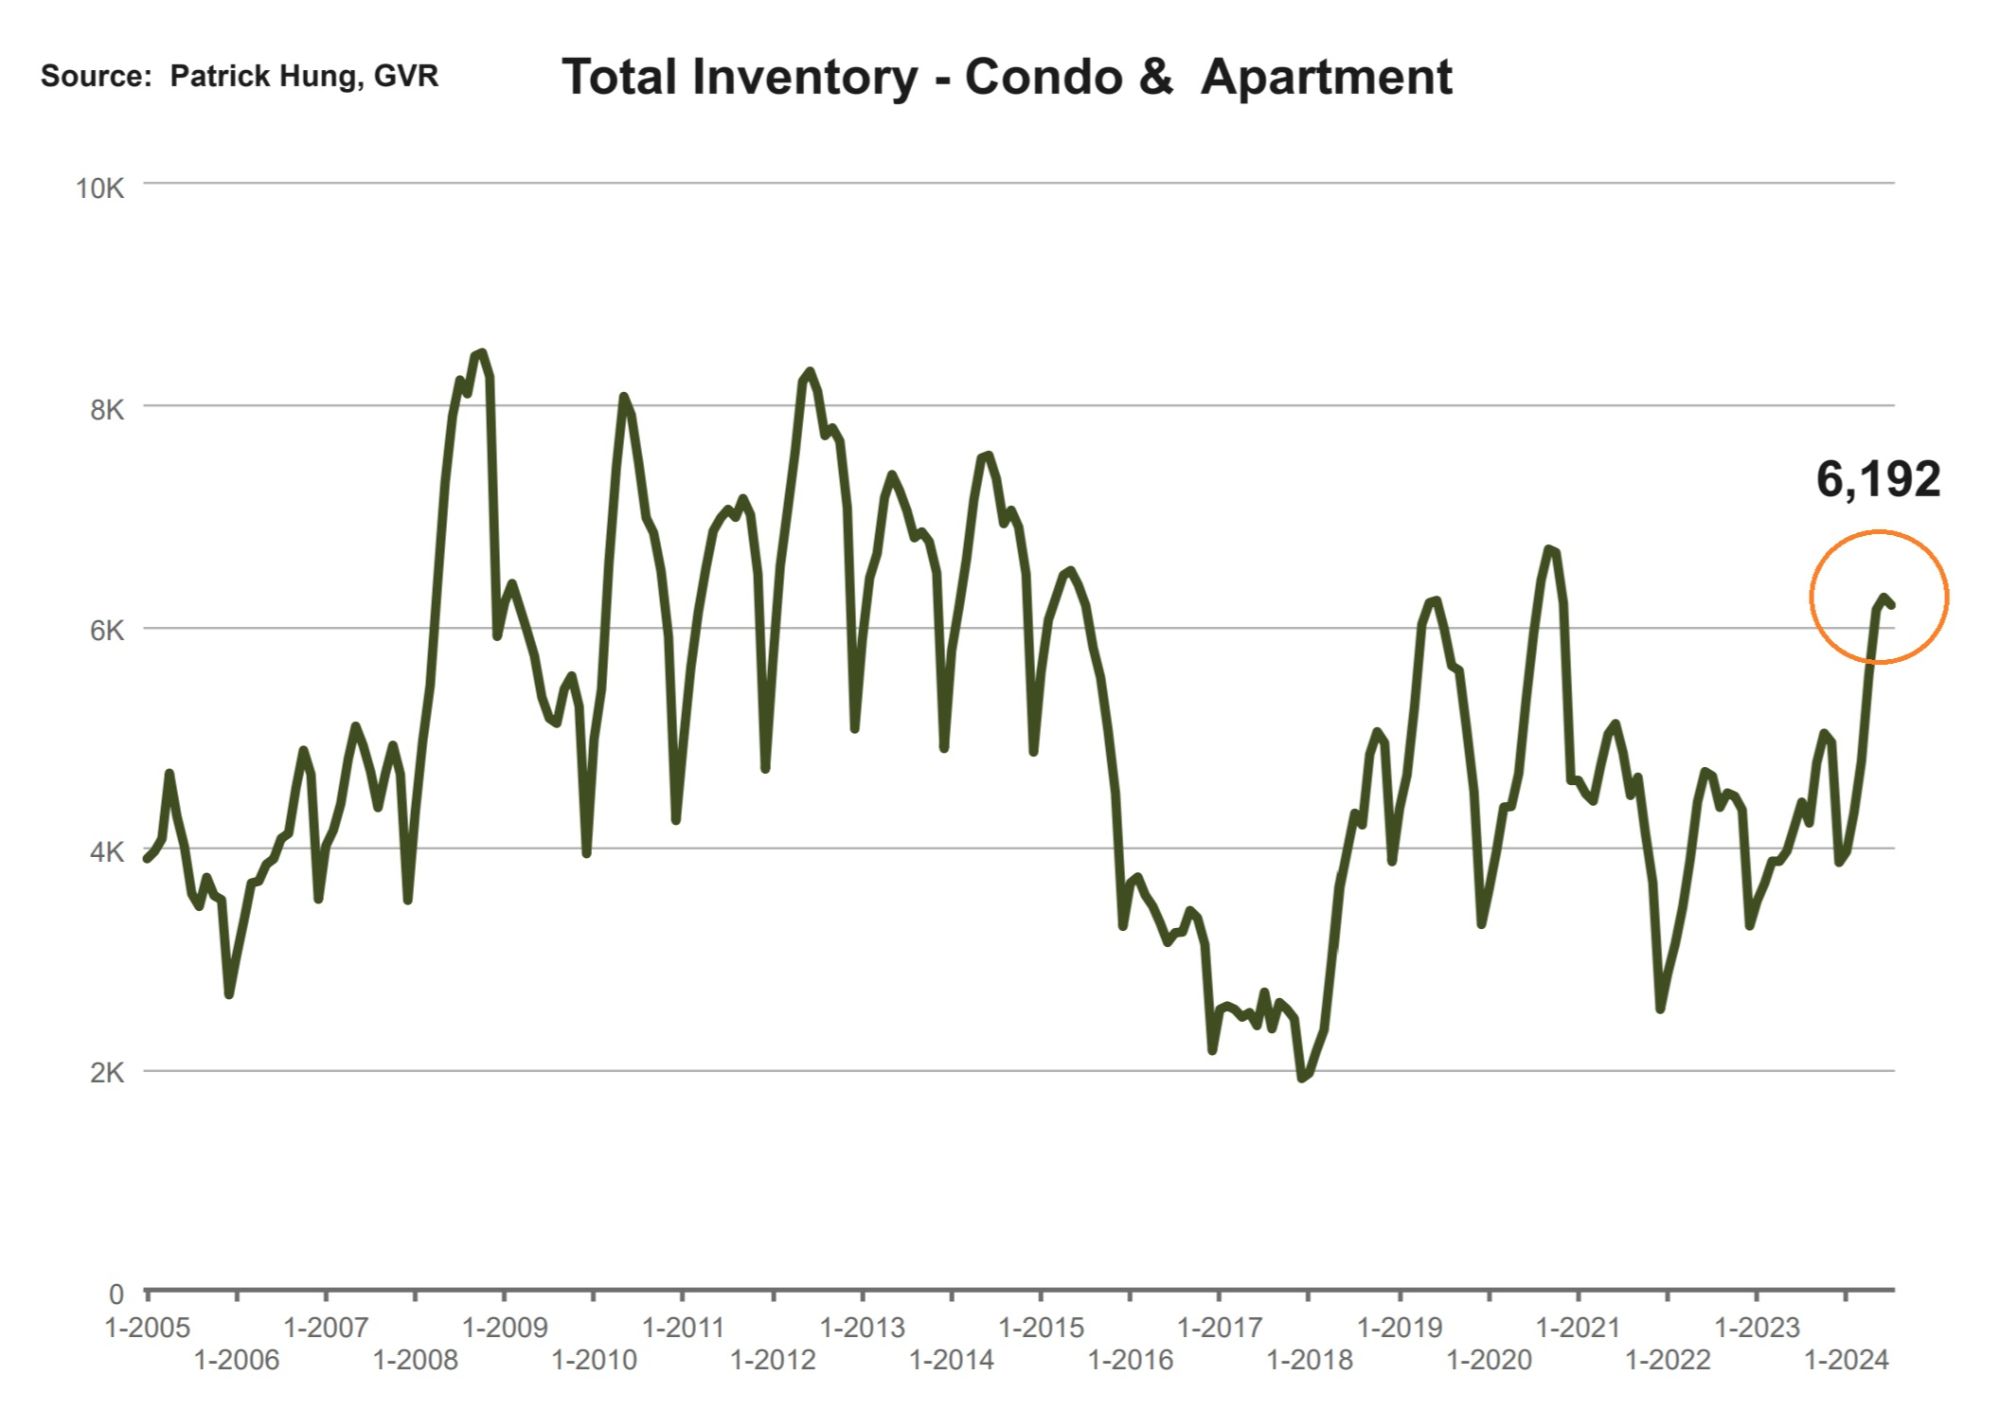
After a sudden surge of apartment inventory created in Spring, this segment seem to have calmed down a bit in July, with apartment's monthly negative price growth (-0.7%) being sandwiched between single house and townhouse. On paper, the apartment is in a balanced market, but in reality, it feels more like a Buyers market. Key difference now is that we are seeing apartment investors continue to exit the scene (and not returning anytime soon). Higher interest rate, stagnant home prices, and dropping rental income are more of the reasons the apartment investors remained sidelined or determined to explore alternative options. As for the pre-sale market, it is just as frothy, especially in Toronto where 70% of pre-sale buyers are investors who have flocked the scene. Vancouver is running along those lines, where both pre-sale and re-sale apartments are seeing a hold-off pattern. The majority of the apartment Buyers now are end-users (such as first time home buyers), and with more rate cuts on the horizon, there is the anticipation that they would come off the sidelines in the Fall. I do believe that the apartment segment, especially the entry level homes, would bounce back quickly and would be able to hold their prices relatively well. However, we do need the interest rates to come down substantially (from current 4.5% to 3.25%) for the market to motivate the Buyers to return.
For the month of July, the best performing neighbourhoods for apartments are Squamish, Port Moody and Coquitlam, posting merely +1%, +0.2% and +0.1% respectively. Conversely, the areas with the most significant price drops were West Vancouver, Richmond and Maple Ridge, with -5%, -1.9% and -1.6% respectively. The apartment and condo segment have finally entered a balanced market, with average days climbing to 29 days (compared to 24 days last month). Month-to-month sale price growth continue to dip into the negative territory at -0.7% (compared to -0.4% last month). Sale-to-listing (% homes sold) ratio remained dipped slightly to 19.3% (compared to 20.3% last month).
Here are the Three Trends I'm Observing:
1. Same Song, Different Tunes
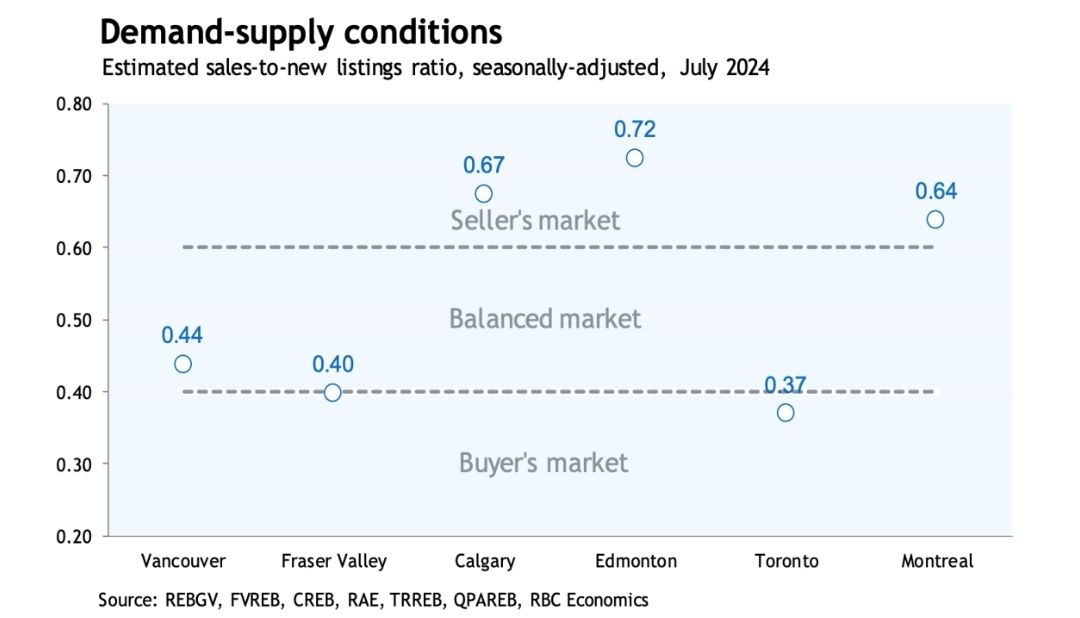
When we see news regarding the Canadian real estate, keep in mind that is a broad brush to paint. Since real estate in nature is hyper local, have a look at Canadian major cities singing different tunes. Calgary, Edmonton, and Montreal are dancing in the Seller's market, while Toronto, Vancouver, and Fraser Valley are panting around the Buyer's market. (Source: GVR, FVREB, CREB, RAE, TRREB, QPAREB, RBC Economics)
2. Exploited Workers
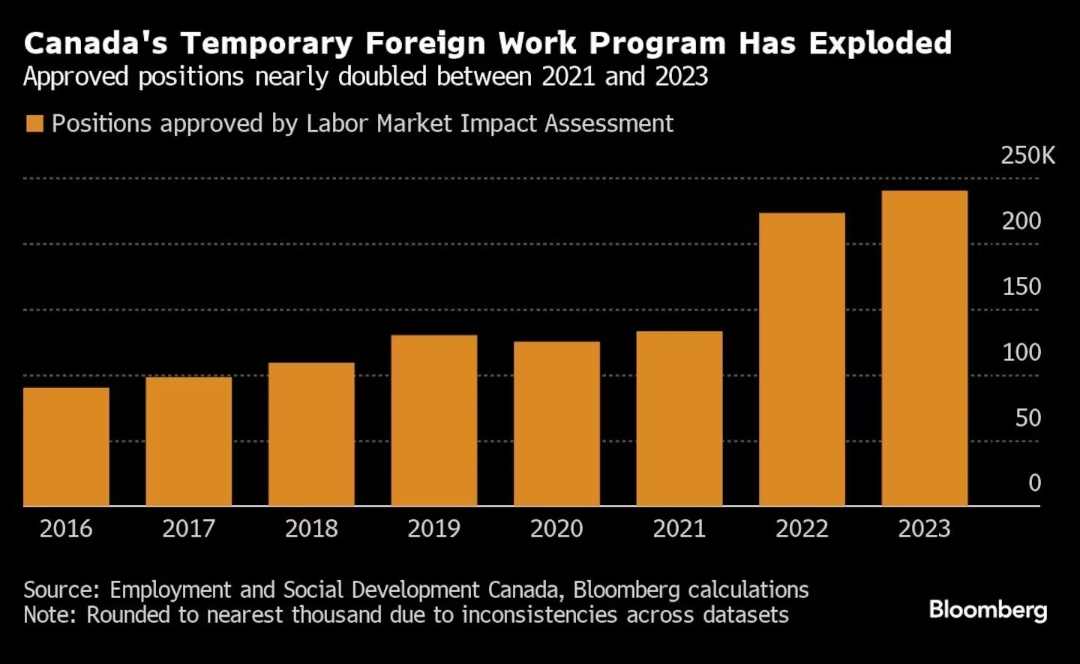
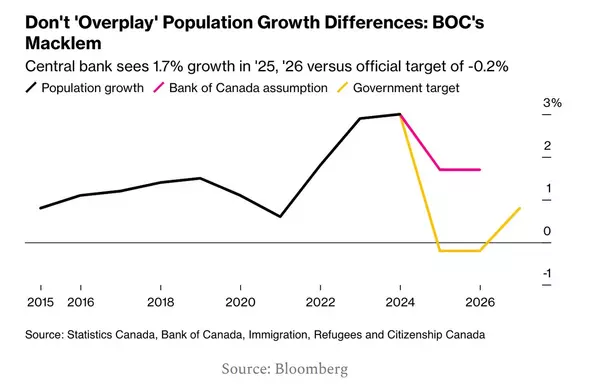
The latest UN report has detailed that Canada's temporary foreign workers have many ways been abused, such as used by immigration programs illegally importing them over and exploited them for different jobs. It's not hard to imagine how bringing in over 450,000 temporary workers in 2 years will drive up the Canadian unemployment rate (especially among the younger workers age 18-24). Employers such as Tim Hortons are also under scrutiny, as they have increased their role of hiring the low-wage foreign workers and further exasperating this problem. Now the news has caught international headwind, it's no wonder Justin Trudeau is back-paddling (again). (Source: Bloomberg)
3. Death and Taxes
Canada is known for its natural beauty and for its high taxes. According to a study, Canadians now are spending more on taxes than basic necessities like good, housing and clothing combined. In 2023, average Canadian family with income of $109,235 paid $46,988 in taxes, representing 43% of their income. Sales taxes (GST, PST), property tax, income tax, capital gain tax, carbon tax... you get the point. Somehow it feels like there are always new taxes implemented every year, which are meant to fix problems and improve the lives of Canadians. But is it? (Source: Fraser Institute)
Recent Posts
GET MORE INFORMATION

