

Real Estate Market Intelligence June 2025

Real Estate Market Intelligence
June 2025
As we approach the summer, the weather is starting to sizzle but the Vancouver real estate market remains cool and sales continue to froze. With 6 months into the downward trend, the real estate market showed increased activity in the first 2 weeks of June. Overall, the cracks remain wide, with this past spring was one of the most atypical season in the Vancouver real estate market in the past 20 years. Lots to touch on this month with the Bank of Canada's rate hold decision, Canada's rising inflation and unemployment rates, and the new depths of the pre-sale condo market. Let's dig deeper.
For the month of May, the Vancouver real estate market continues to trend of "more listings, less sales", with sales -30.5% below the 10 year average, while total listings (inventory) rises to +45.9% above the 10 year average. To put the numbers into perspective, this past May's sale is the lowest sales for the month in 20 years (outside of the May 2020 due to pandemic). Meanwhile, total inventory has risen to its highest level in 10 years. If we adjust the sales for all the immigration and the rising housing demand in the past 10 years, one can interpret the numbers in a much worst state than it is. Diving deeper, the spread between the sales and demand has reach 76.4% difference, and has been trending between the 70-80% mark for the past 3 months. With boots on the ground and having spoken with other top producers in the industry, the first two weeks of June said increased activity, both in terms of traffic, offers, and sales. Some stale listings have actually been sold. Yet, the market continue to be severely segmented. For example, the condo market is still sluggish with more pre-sale projects coming up for completion, causing more listings to flood the market. Many condo open houses report no traffic, or has only 1 showing request in 2 weeks with no offers. Many of these condo Sellers are stuck between a rock and hard place, whether to take a $100k loss or slow bleed with negative monthly cash flow. But again, just how long can and will the slow bleed go on for? Meanwhile, single house and townhouse remain a bit more resilient, and again with entry level home price starting to hit a bottom (i.e $1.6m single house and $1.1m townhouse in Greater Vancouver). The market is at a point where there is a clear distinction between sellers who are interested, or committed. I've had many conversations with Sellers, and some are still wanting to test the market, only to find out that they are on the back foot against other Seller who are committed. The current market is not for the hopeful Sellers, where their mindset is still in 2021 and thinks listing high and wait for offers. As more listings pile up, we are seeing homes sitting longer on the market for 3-6 months, even with multiple price reductions. On the flip side, most Buyers are still sitting on the fence, patiently waiting for a good deal or to see the first sign of a possible market recovery. Such holding pattern has driven Sellers ever more anxious and upset as they go through the entire roller-coaster ride of emotions: from being hopeful when it was first listed, to disappointment when seeing little traffic and no offers, and to upset as the market trends downwards and seeing their neighbors selling for far less than they expected, and at last, to angry at the market and their real estate agents. The Vancouver real estate market had been mainly dictated by Sellers market in the past two decades, and now the tides have turned, many Sellers simply fail to adapt. Whether they like it or not, it is the Sellers who do adapt the fastest are the ones who will successfully sell their homes.
On top of those Sellers who are unhappy, there has also reports that real estate agents are turning down listings and away Sellers. While this was not common, I can confirm that it is happening more often this year. Simply put, unrealistic Sellers are an unprofitable business. Imagine you're the real estate agent and every listing requires investment of money and time into it, before even making a penny of of commission is earned. Costs such as pictures, videos, floor plans, listing fees, white posts for sale signs and installation, title search, and time invested to host open houses and private showings. All this can mount to thousands of dollars per listing. Now imagine multiplying that by 10 or 20 listings for top producers. If Sellers just wants to "test" the market with unrealistic pricing while having 20 other competitors in the same building, then top producing agents would rather walk away and better invest their time on Sellers who are serious. In 2021-2022, overpricing strategy could still work at time. Now, listing with a high price is seen as a waste of time. By the same token, agents who only does a handful of listings for the year will fail in the current market, and will soon drop out of the industry altogether. As real estate sales hit multi-decade lows, just how many months can agents go on without a commission cheque? If a cleansing is coming to the real estate market, then it will wash away both unrealistic Sellers and low-producing agents as well.
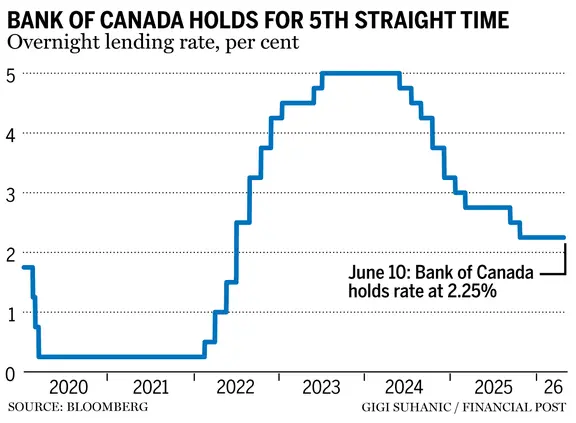
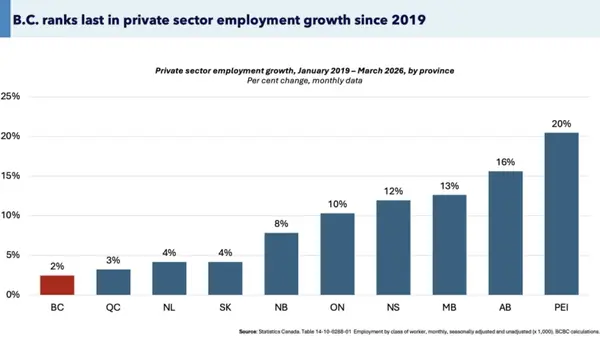
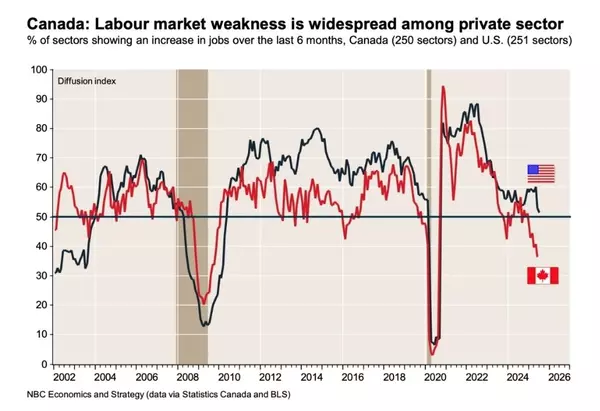
On the economic front, the Bank of Canada held it's rates for the second time and has been sitting at 2.75% since March. As the noise of cuts become louder, Bank of Canada has to choose between a sinking economy and risk of rising inflation. To make matters worst, Canada's unemployment has risen to 7% (from 6.9% in April), and its the third consecutive month of rise in unemployment. In recent memory, Canada has not seen unemployment rate at this level since the 2020-2021 pandemic era, and dates back to 2016 when it's been this high. Even though the tariff news have subsided in the past few weeks, it is still an evolving situation to see just how much the Canadian economy is hurting. Canada's trade deficit in April hit a all time record high of $7.1 billion. Manufacturing jobs are vanishing, especially in Ontario auto, steel and aluminum sector. Reports coming out of Ontario is that its province's unemployment rate is at 7.9%, nearly 1% higher than the national average. Ad most indicators point to higher unemployment in the upcoming months, the youngest workforce between 18-24 years old got hurt the most, at 15% unemployment rate, which is the highest in 25 years. On the bright side, Mark Carney is trying to strengthen Canada from within and increase inter-provincial trade by removing barriers. It is certainly welcoming news, but just how fast and effective this can be implemented remains a big question. Key is, if the Canadian unemployment and economy continue to deteriorate, then just how much room can the real estate market recover if people are worried about losing their jobs?
Some of the unique trends I've been observing:
1. Bank of Canada decided to hold its ground and rates at 2.75% in June. I do feel the Bank of Canada do have their hands tied and have very limited options. My bets are they will remain in a holding pattern in July, but may be more inclined to cut in September. But keep in mind, another 0.25% cut doesn't really move the needle much, certainly for real estate Buyers and definitely not for businesses. We will need something substantial, along the lines of 0.75% cut, in order to get the Buyers to come off the sidelines.
2. The Vancouver real estate market in May continued its downward spiral and sinking to depths near the 20 year lows (outside of the pandemic), with monthly sales dipping further to -30.5% (compared to -28.2 in April) below the 10 year average, while total inventory continues to pile up to +45.9% (compared to +47.6% in April) above the 10 year average. The split between the sales and inventory in April was 76.4% (compared to 75.8% in April). For the last two weeks, we are starting to see increased activity. While this may be a blip in the map, anything that's coming off record lows would be considered significant. Meanwhile, summer is one of the slowest seasons in real estate. Would this possibly be an atypical summer coming up?
3. Canada's unemployment rate has climbed for the third consecutive months to 7% in May (up from 6.9% in April). The duration of unemployment is also rising, currently at 21.8 week compared to 18.4 weeks from a year ago. Even though the tariff news seem to have subsided for the last few weeks, the actual pain was shown in the numbers released in Canada's biggest trade deficit at $7.1 billion. Manufacturing (especially in Ontario) is shrinking, and business big and small are unable to plan for anything anymore. Unless something dramatically happens, Canada's unemployment in Q3 is poised to rise further.
4. When the Vancouver real estate market hits a decade high inventory and the market is really sluggish, some unrealistic Sellers still thinks its 2021 and price their home way over market value. Thus, we're seeing more real estate agents beginning to turn down listings. As their costs pile up, each listing cost approx $2000-3000, and 20-30 hours committed, with a serious concern of money and time invested with no return. Top producers having 20-30 listings are trying to stay afloat as costs pile up and only a handful of sales. In short, unrealistic Sellers are an unprofitable business. When the tables have turned, some Seller who insist on testing the market rather than committed to selling, may be better off just renting out their place, even though that option is not that much better off with falling rents. As these Sellers are stuck and getting impatient and upset, guess who they get blame first? You guessed it: their real estate agents.
5. Speaking of inventory pileup, the Toronto real estate market has just surpassed a record of 30,000 total listings in May. If this continues, it may soon eclipse the all time high mark. On the other hand, Vancouver is faring a bit better, but sales remains weak and will take a long time to clear out the current inventory.
6. The Canadian real estate is in a cleansing mode right now. Cracks are widening, investor pool is shrinking, rent yields are stagnating, and future appreciation is diminishing. Historically, Vancouver real estate takes 6-9 months to get out of its funk and recover from its trough. And perhaps, this time it's different.
Here are the 3 highlights for May:
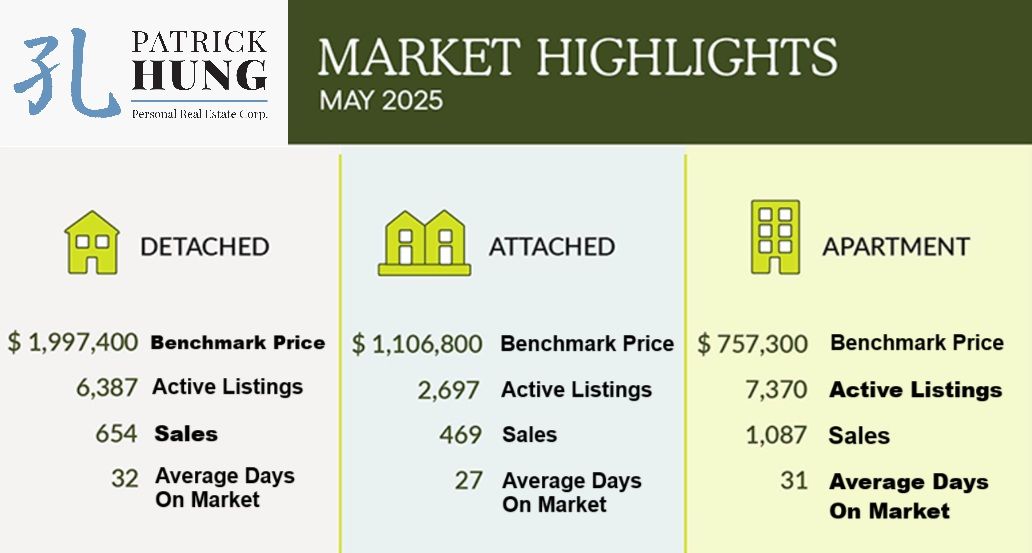
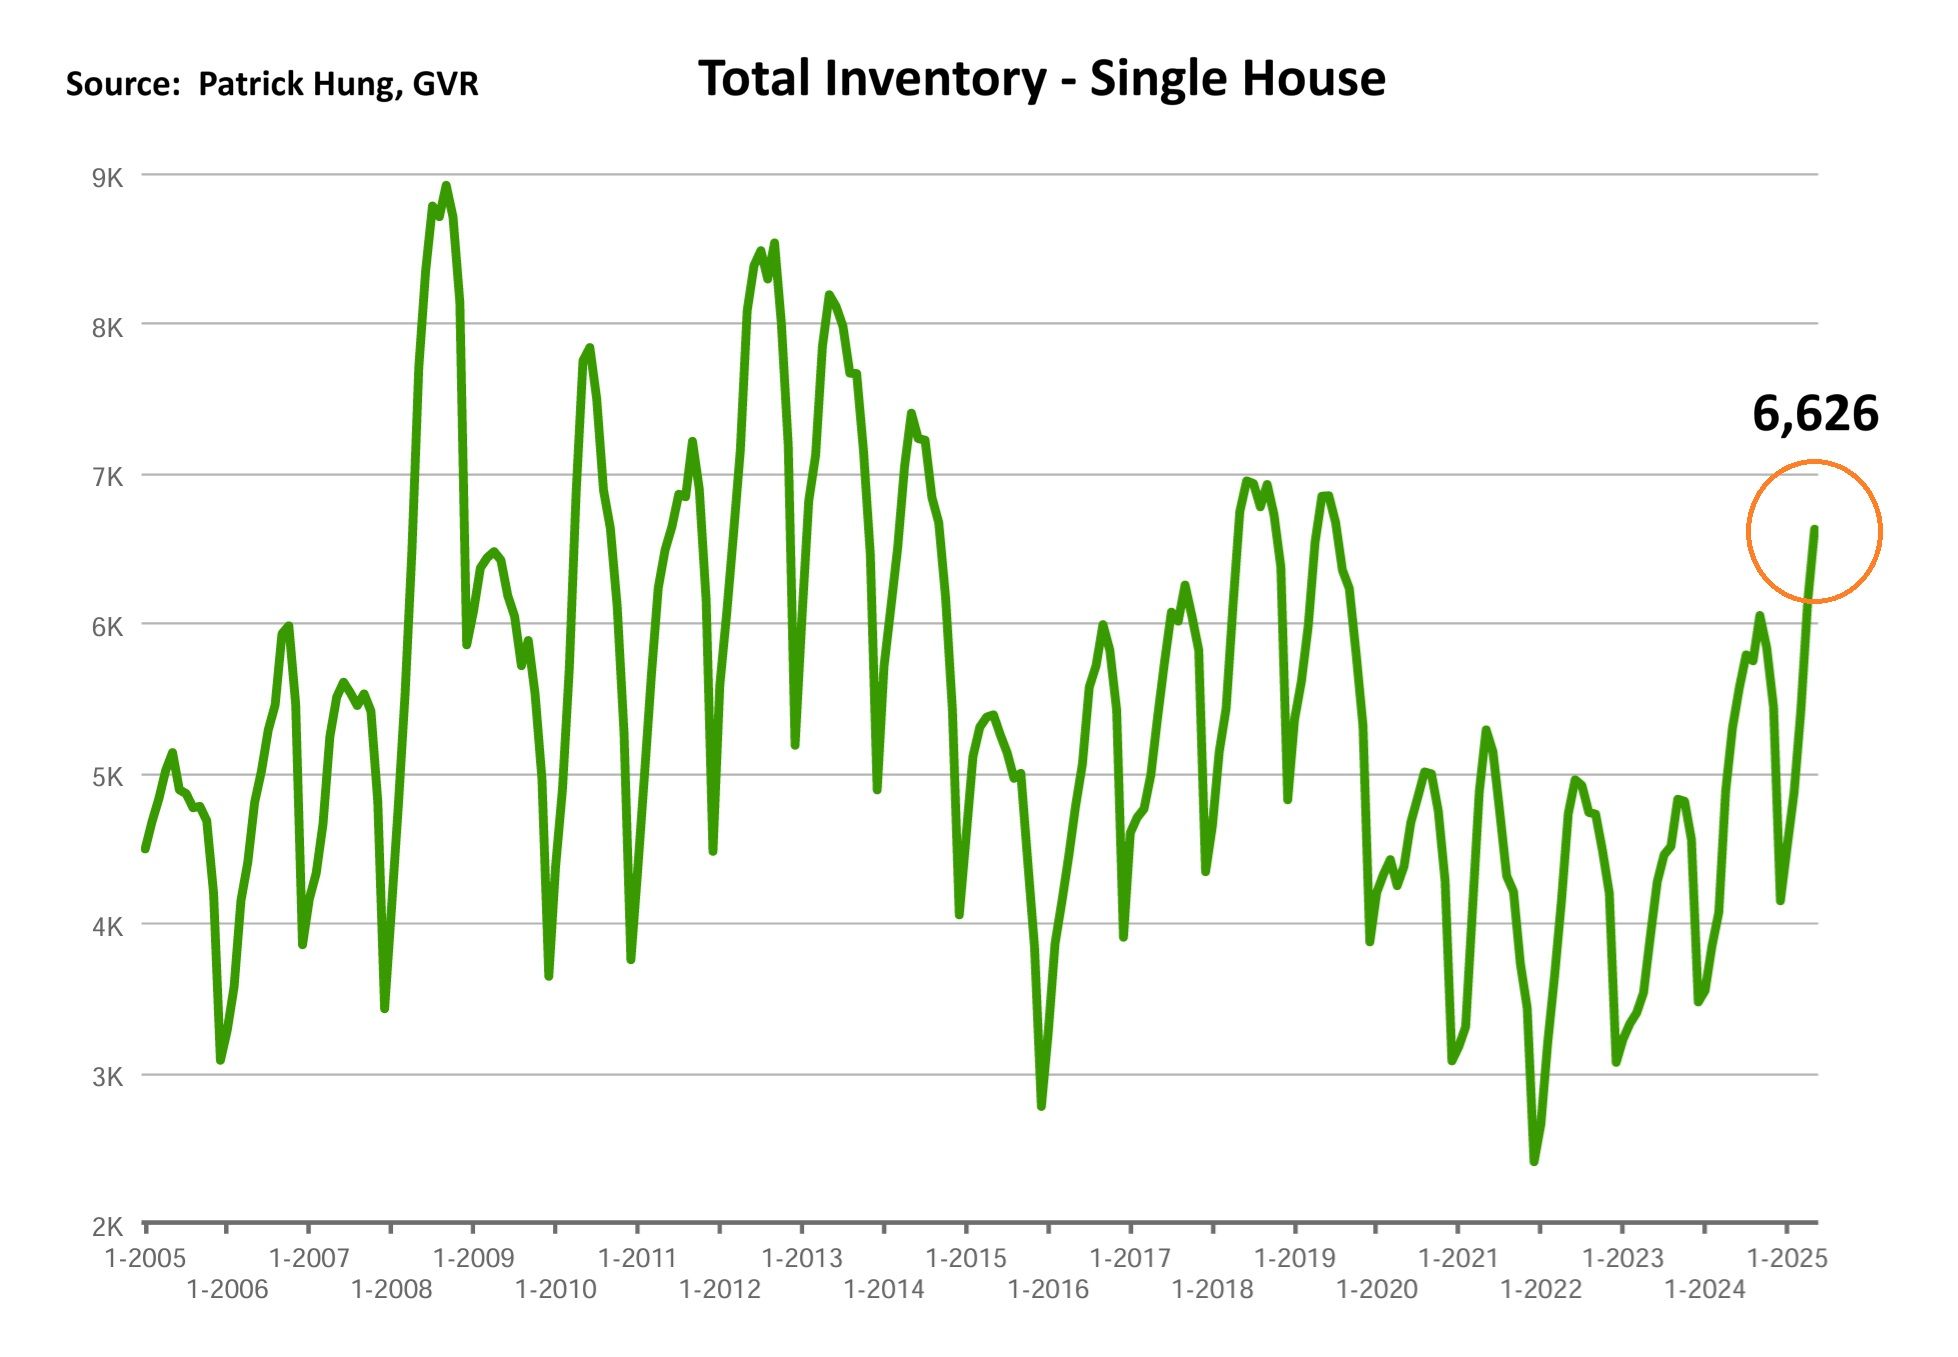
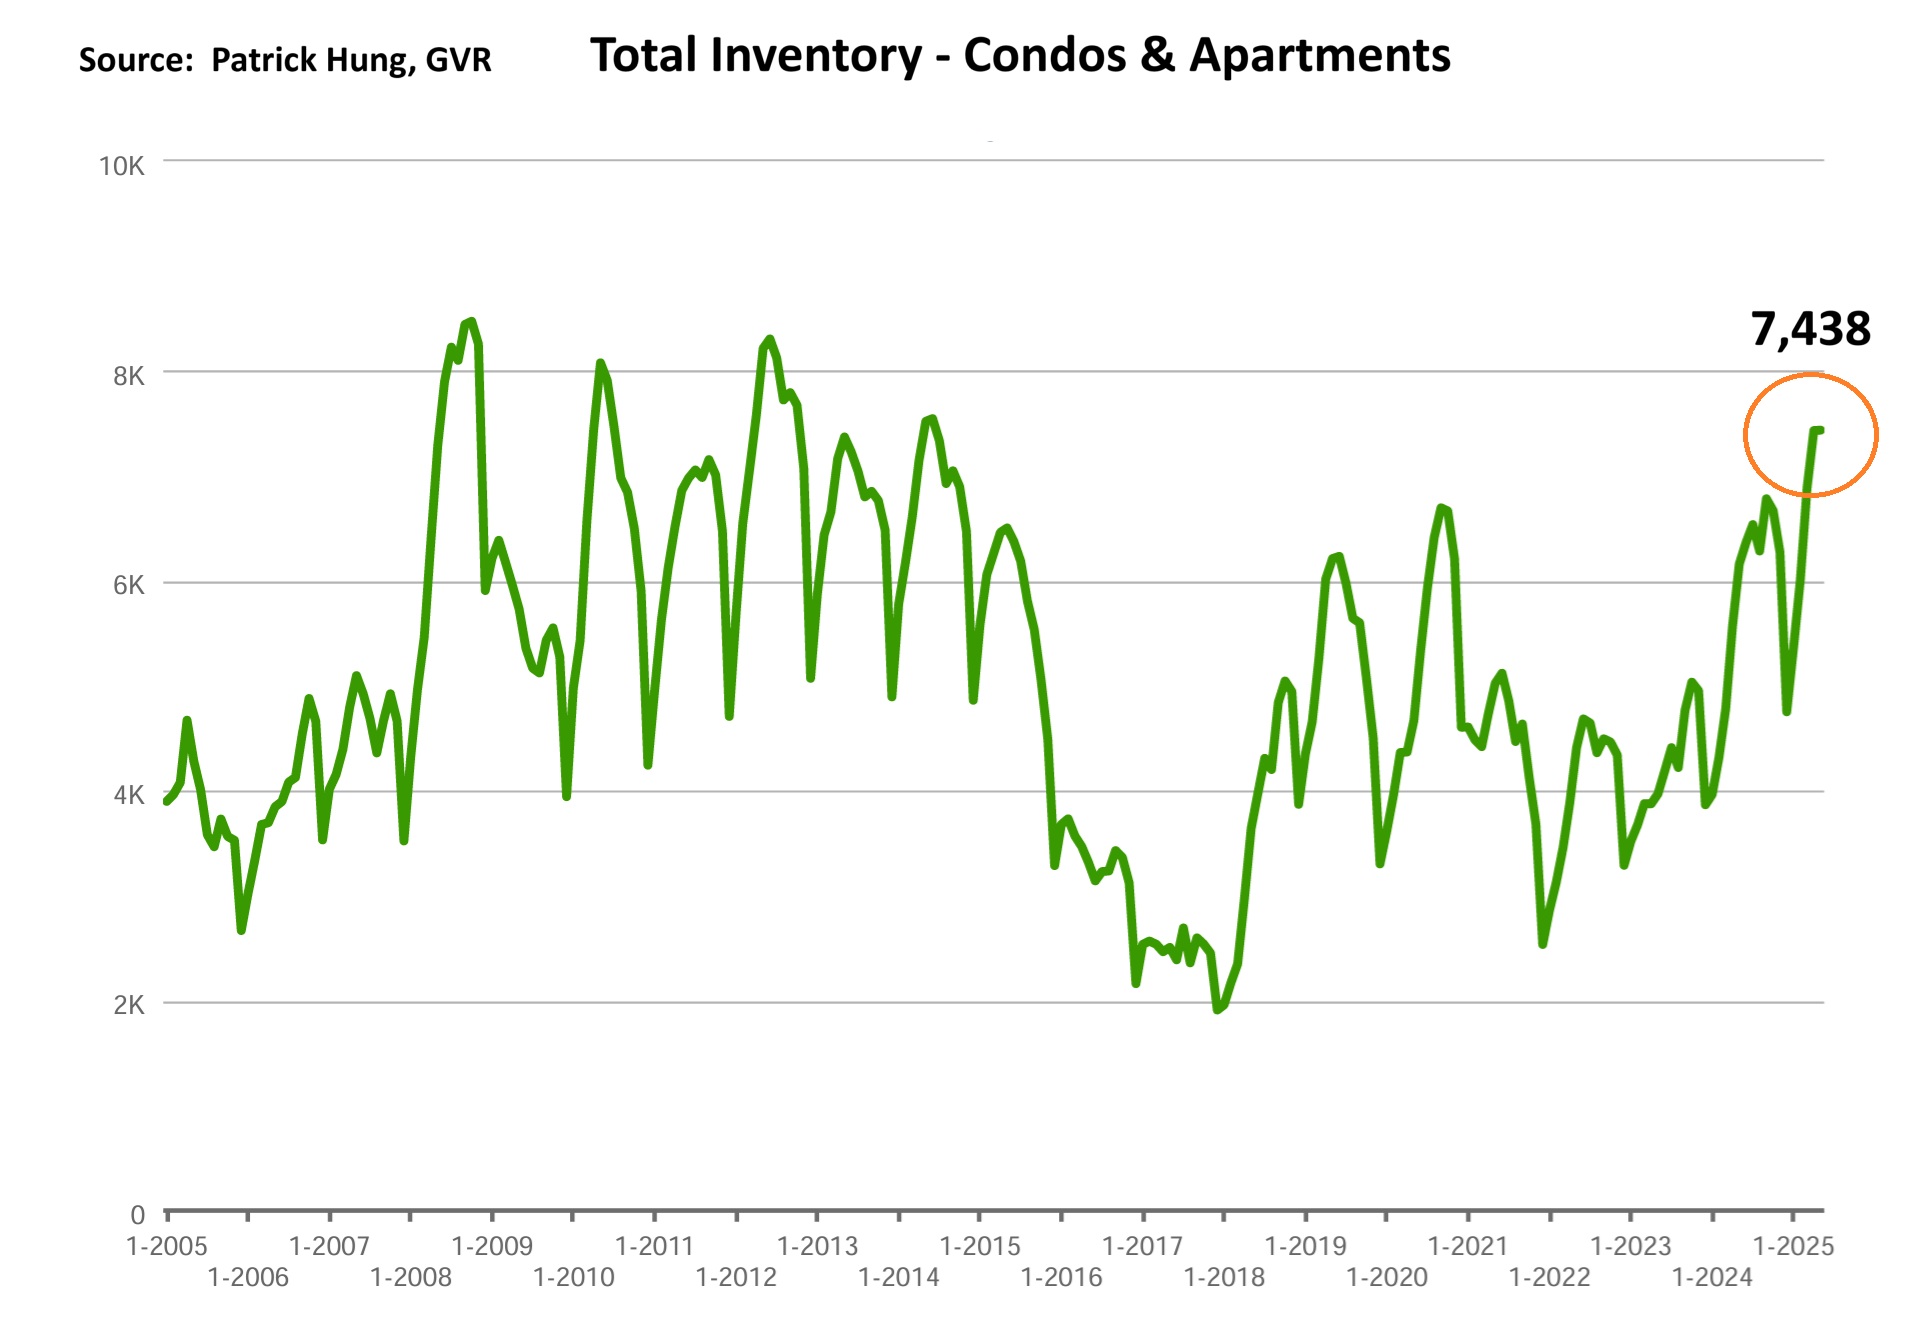
- Total inventory of 16,779 units is the highest May total inventory since 2014.
- May continues the downward spiral trend of sales, even though the first 2 weeks of June are showing signs of an uptick in activity. Some may say that any increase coming off historic lows may be considered significant.
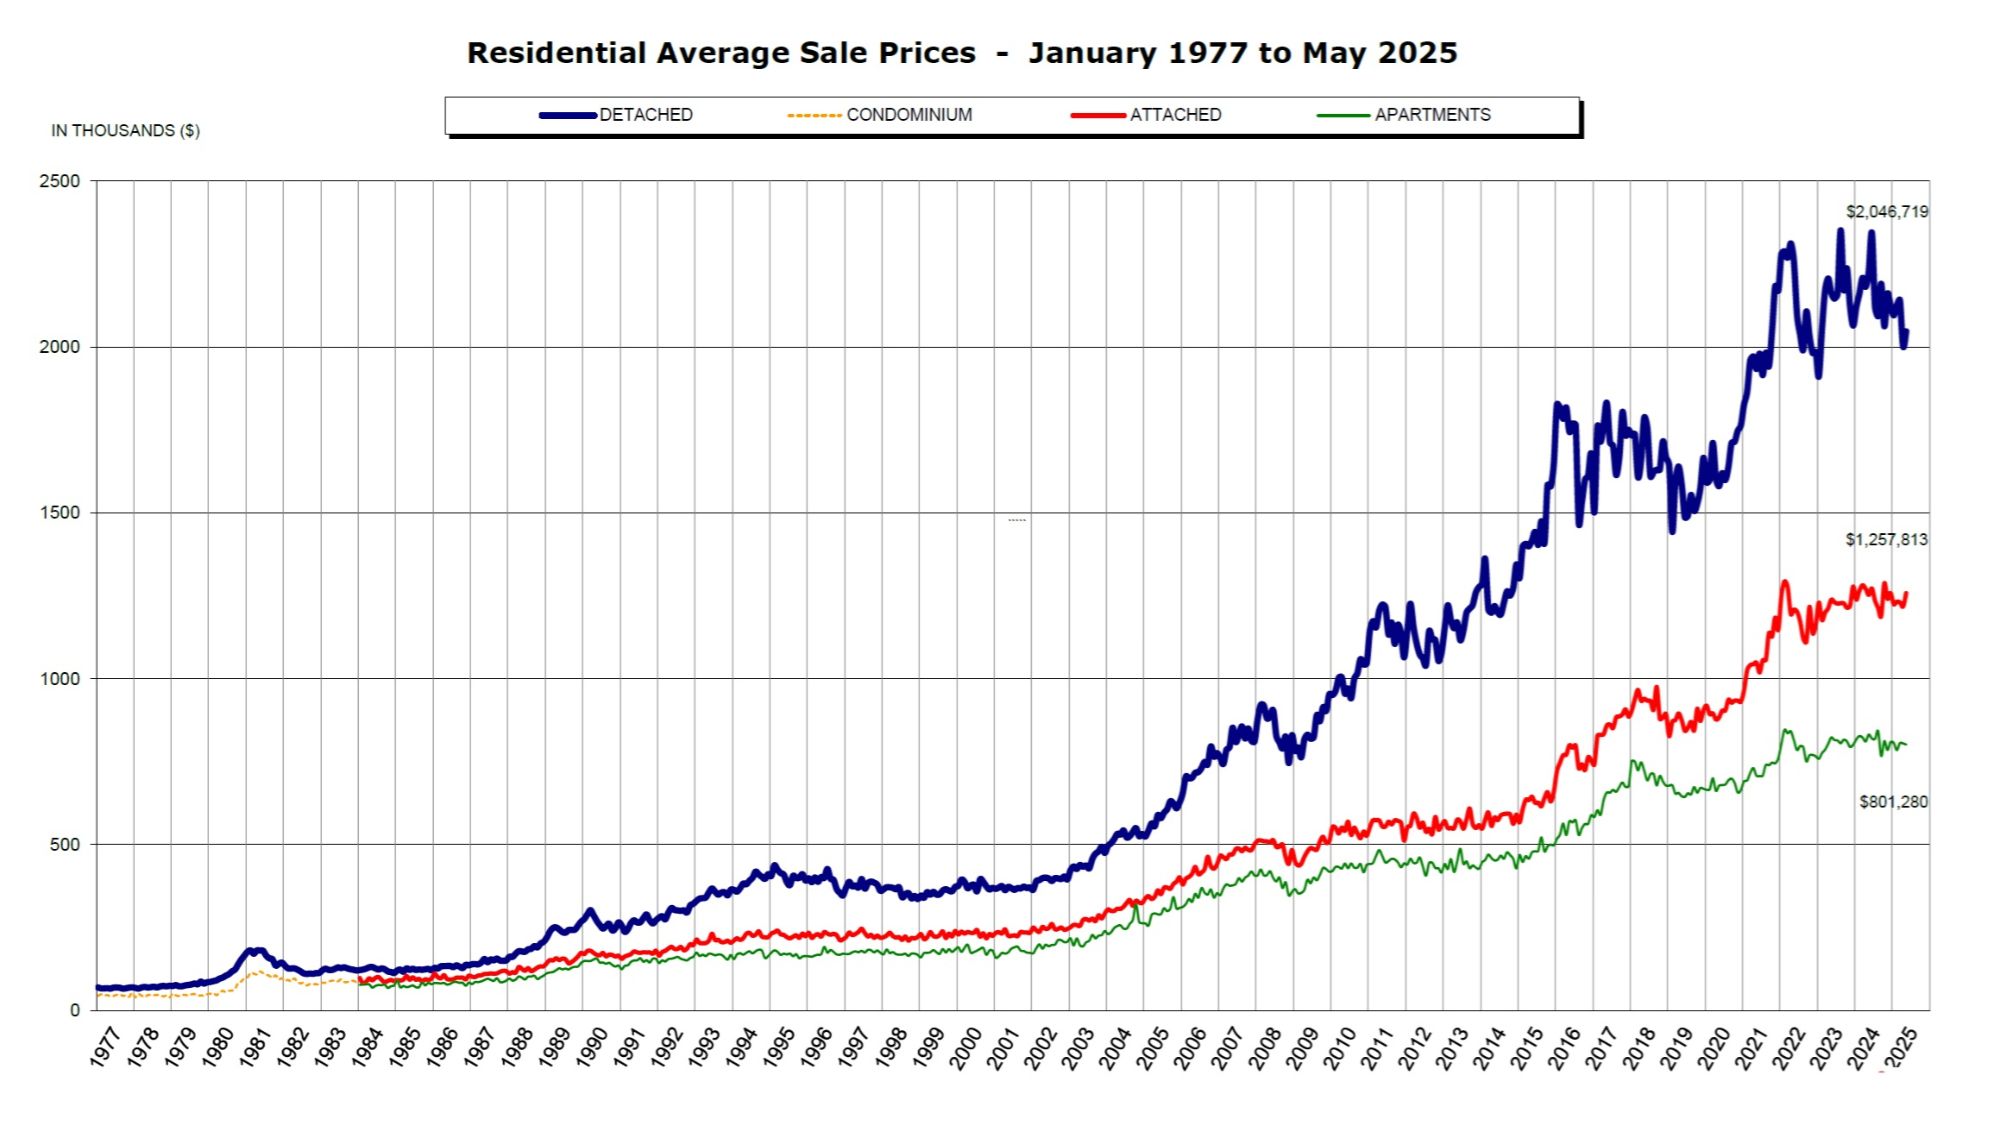
- Prices slipped slightly last month by -0.6%, and for the past 3 months the average price remained nearly flat at -0.7%. Anecdotally, it feel the market has dropped much more than that.
Here are the in-depth statistics of the May:
- Last month's sales were -30.5% below the 10 year May's sales average.
- Month by month residential home sales increased by +3.5% from April 2025.
- Month by month new home listings continue to climb by +3.5% compared to April 2025.
- Last month's price remain nearly flat at -0.6%.
- Sales-to-listing (or % of homes sold) ratio is remained flat at 13.4% (compared 13.8% in April). By property type, the ratio is 10.2% for single houses, 17.4% for townhouses, and 14.7% for apartments/condos.
Download June 2025 Greater Vancouver Real Estate Report
Single House Market
Much like April, the single house market in May continue with increase in total inventory, causing further downward price pressure. Many Sellers are starting to accept this new reality, and asking prices have been coming down. Historically, single house Sellers can weather the storm much longer than other segments (i.e apartments) because such sellers have more equity baked into their homes and for a longer period of time. Imagine a baby boomer in their 60's whom have purchased their home 30 years ago. Now their mortgage is paid off and sees a $1.3m increase in home value (tax free) in their principle residence. Compare that with a young apartment owner whom have purchased 5 years ago and only saw an $100k appreciation in their homes. Even though single house inventory is in its highest since 2019, these Sellers have pockets deep enough to take their home off the market now, and wait till conditions improve before re-listing. For this same reason, the single house segment is more prone to a quicker rebounded (with less similar products). However, last month we are seeing single house prices dropped -1.2%, which is the highest across all segments. Diving deeper, the core Metro area such as Vancouver East & West, Burnaby and Richmond, all saw more surprising and sudden price drops of nearly -2% between them. North Vancouver is the outlier, with +1.9% price growth. Overall, I don't expect any price recovering in the summer. Best case scenario would be flat lining, but that also depends on just how much more new inventory will come onto the market to compete.
For the month of May, the neighorhoods that registered most price growth were Bowen Island, Sunshine Coast and North Vancouver, posting +7%, +4.5% and +1.9% respectively. Conversely, the neighborhoods registered the most significant price drops were Burnaby East, New Westminster, and East Vancouver, with -5.2%, -4.5% and -4.4% respectively. The single house market continues to be in a Buyers market for the fifth consecutive months, with average days on market dropping slightly to 32 days (compared to 35 days in April), and month-to-month average price dropped further by -1.2% (compared to -0.6% in April). Sales-to-listing ratio (% of homes sold) remained nearly unchanged at 10.2%. (compared to 9.9% in April).
Townhouse Market
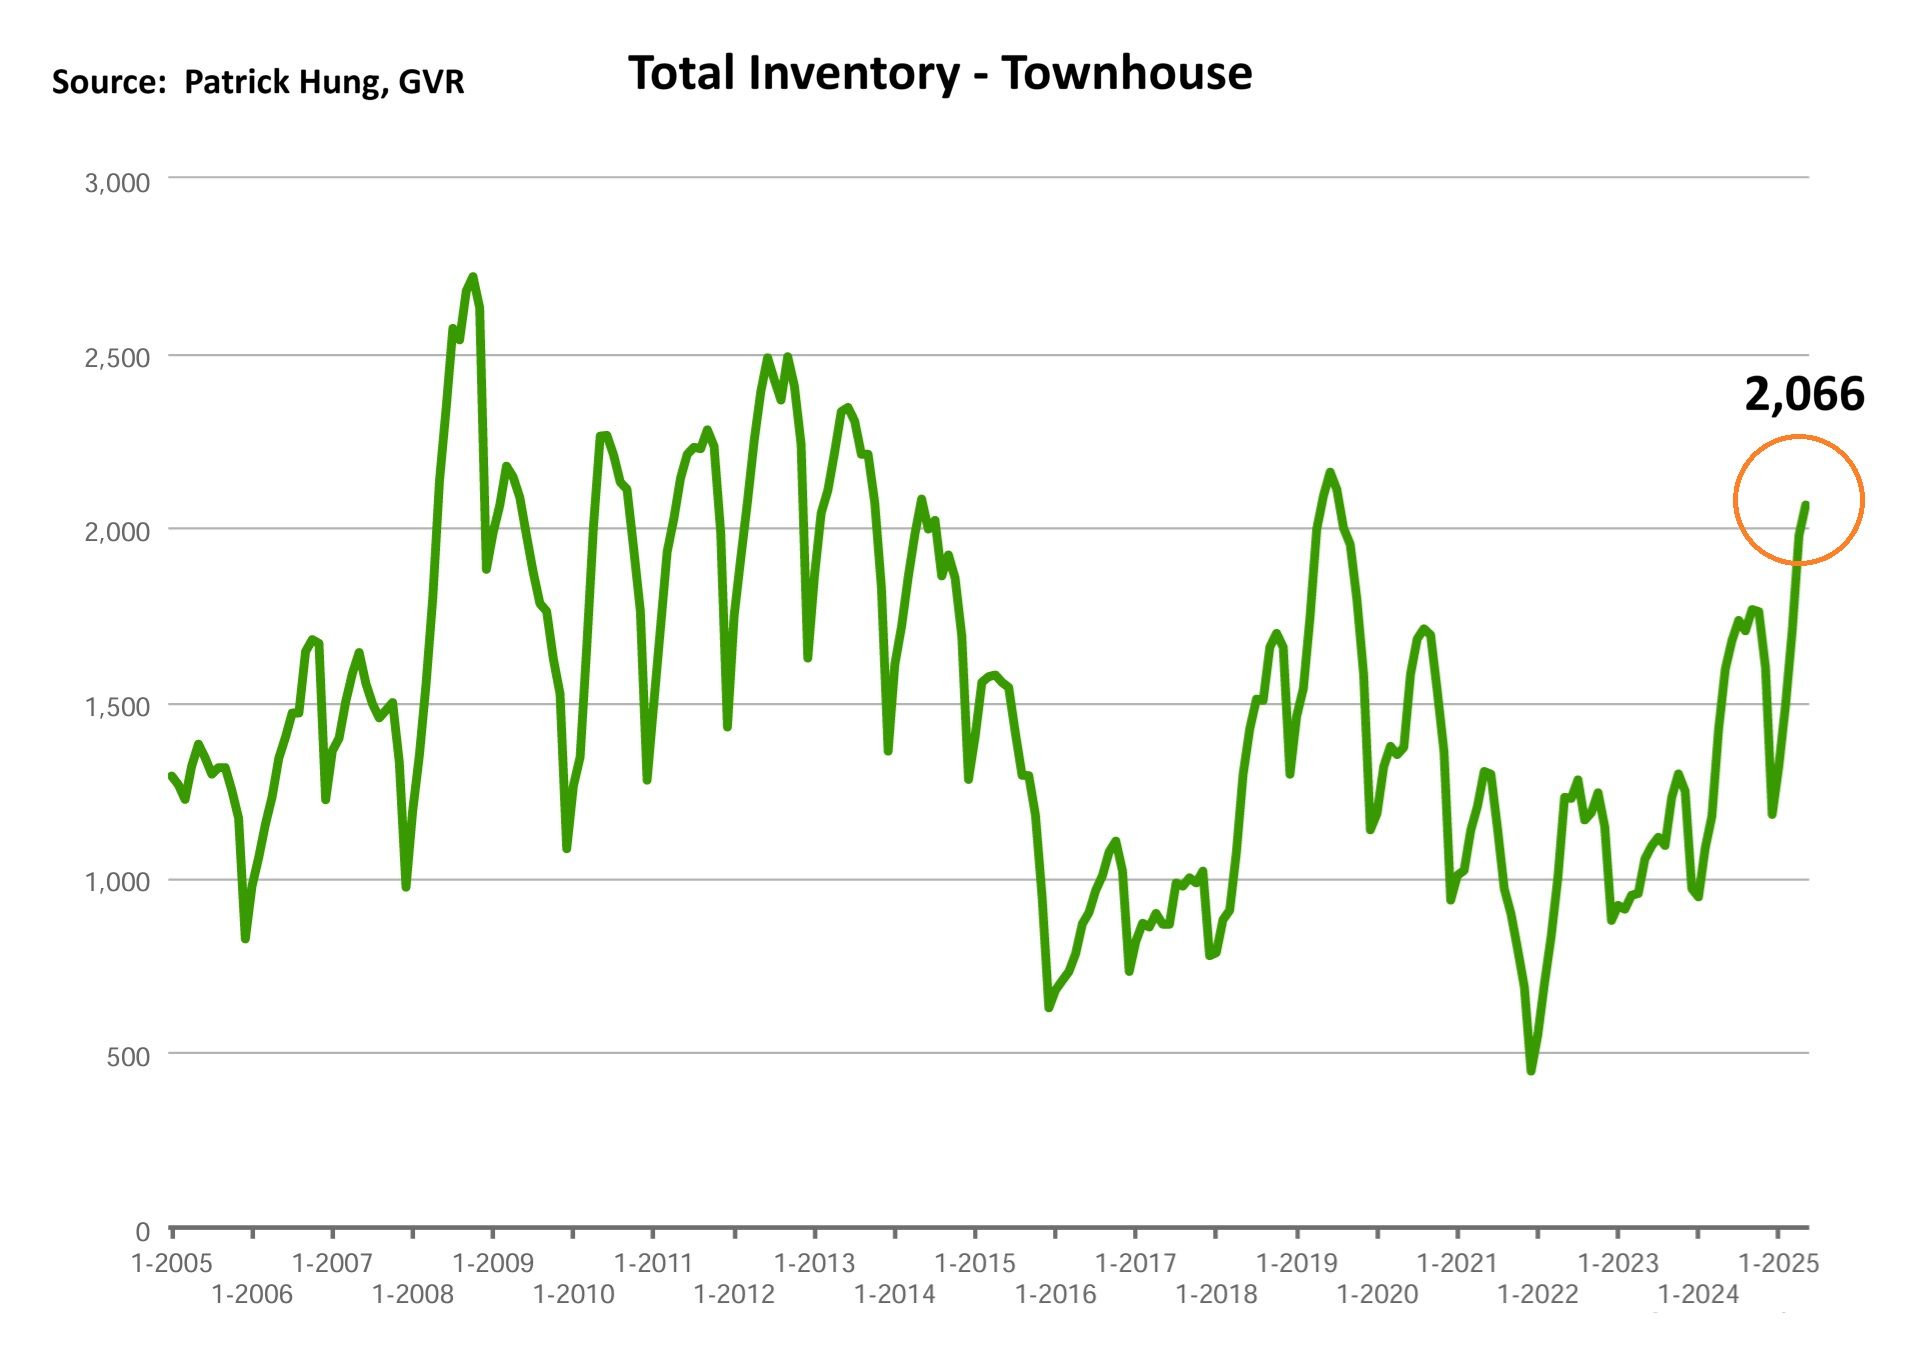
Overall, the townhouse market seems to be the best perform segment in this downward trending market. On the supply side, the townhouse market is following a similar path to the single house. Last month, townhouse price went up by +0.4%, while sales-to-listing (% of homes sold) was 17.5%, and days on market is 27 days, which all three stats are the best across all segments. Anecdotally, I do feel that the open house and showing requests are the best amongst all segments, and but price has come down to a point where Buyers are receptive. Townhouses sellers, too, are now starting to price competitively. Given in some Metro Vancouver townhouse entry level price point hoovering around $1m, this posies a great opportunity for the up-sizing Buyers to move in that has not been seen since 2019. As for Fraser Valley where the supply is much more abundant, some Sellers are pricing even more aggressively to make a move. As real estate is hyper local, I would except neighborhoods such as Surrey and Langley, where there are more pre-sale townhouses competing in the same space as re-sale, will have a greater downward price pressure than the Metro Vancouver townhouses. On the other hand, Burnaby, Richmond and Ladner townhouses seem to have hit a price floor for now. One of the metrics that I'm also monitoring is the total inventory vs. sales, which for townhouses they are both almost in a lockstep and increased between 4-5%. Summer tends to be a slower season, and as townhouse Sellers are mainly composed of young families with children, they too, may elect to take a break. I would be pleasant surprised if the townhouse market sees an uptick in the summer.
In May, the areas with the most townhouse price growths were led by North Vancouver, Ladner and Tsawwassen, registering +2%, +1.6% and +1.% respectively. Conversely, the neighborhoods with the negative price growth were in Pitt Meadows, Vancouver East and Vancouver West, at -2.5%, -0.6% and -0.4% respectively. The townhouse market remained in a balanced market with days on market rising to 27 days (compared to 25 days in April). Month-to-month sale price increased by +0.4% (compared to -1% in April). Sale-to-listing (% homes sold) ratio remain the best performing segment of all and is flat at 17.4% (compared to 17.5% April).
Condo Market
After months of rising condo inventory and the record number of pre-construction pending for completion this summer, the condo market in May had seen a surprisingly no increase in total inventory. Coincidentally, the month-to-month apartment sales dropped off -1.9%, which is the only segment that saw a drop in sales in spring. In short, the demand for condo is further weakening. Anecdotally, some areas (where once was investor-heavy, such as Brentwood, Metrotown, and River District in South-East Vancouver) are seeing much more competition flooding the market. For example, in one of my listings in River District in East Vancouver, there were 19 new competitors over a 49 day span (or 1 new competitor every 2.6 days). This has created enormous downward price pressure that has proven hard for Seller to catch up to: what was once a last record sales in the building is no longer considered valid. Reason is that last sales in the area are not attracting the similar bids anymore. For example, a similar unit with the same floor plan, in the same building was last sold a month ago for $600k. The Seller prices it competitively at $599k, hoping to get a bid around $590k. Then 2 weeks go by, and no bid. A month later, the Seller decides to drop price to $589k. Another 2 weeks go by, and again no bid. So just how far does the Seller chase the market? In the face of net-zero immigration and falling rent, compound with provincial laws to overprotect the tenants, the condo Sellers are face with the dilemma of falling sale prices and lower-quality tenants. Either way, I believe the worst hit condo are those that are sub-600, where most Buyers would elect to pay a little more for a 2 bedroom or a larger 1 bedroom. As condo buyers remain in a holding pattern, I expect this past month's surprisingly flat inventory is just the lull before the storm. Condo owners, brace yourselves: it's going to be a long and bumpy ride.
For the month of May, the best performing neighbourhoods for apartments were all in the outskirts of West Vancouver, Whistler, and Squamish at +6.1%, +2.9% and +1.7% respectively. Conversely, the areas with the most significant price drops were South, Richmond, and Vancouver East, posting -2.9%, -1.7% and -1.1% respectively. The apartment and condo segment remained in a balanced market, with average days on market flat at 31 days (same as last month). Month-to-month sale price continue to slip at -0.7% (compared to -0.6% in April). Sale-to-listing (% homes sold) ratio also dropped slightly to 14.7% (compared to 15.7% in April).
1. New Territory
After an explosive immigration in the past 2 years that absorbed over 4 million new residents , Canada's net-zero immigration policy has now reach new depths not seen since 2020 (pandemic) and 2015 (global energy downturn). As Canada is basically an immigration country that relies heavily on immigrants providing services (i.e healthcare) to support the aging population, the temporary unskilled workers that Canada absorbed in the last two years created so much political unrest and sociological tensions (i.e rising unemployment, especially youth unemployment, which was highest in 25 years). Ontario and BC were the two provinces that continue to see negative population growth, with -5,400 and -2,700 people respectively. Alberta is solely carrying Canada's immigration, with +20,500 newcomers there. 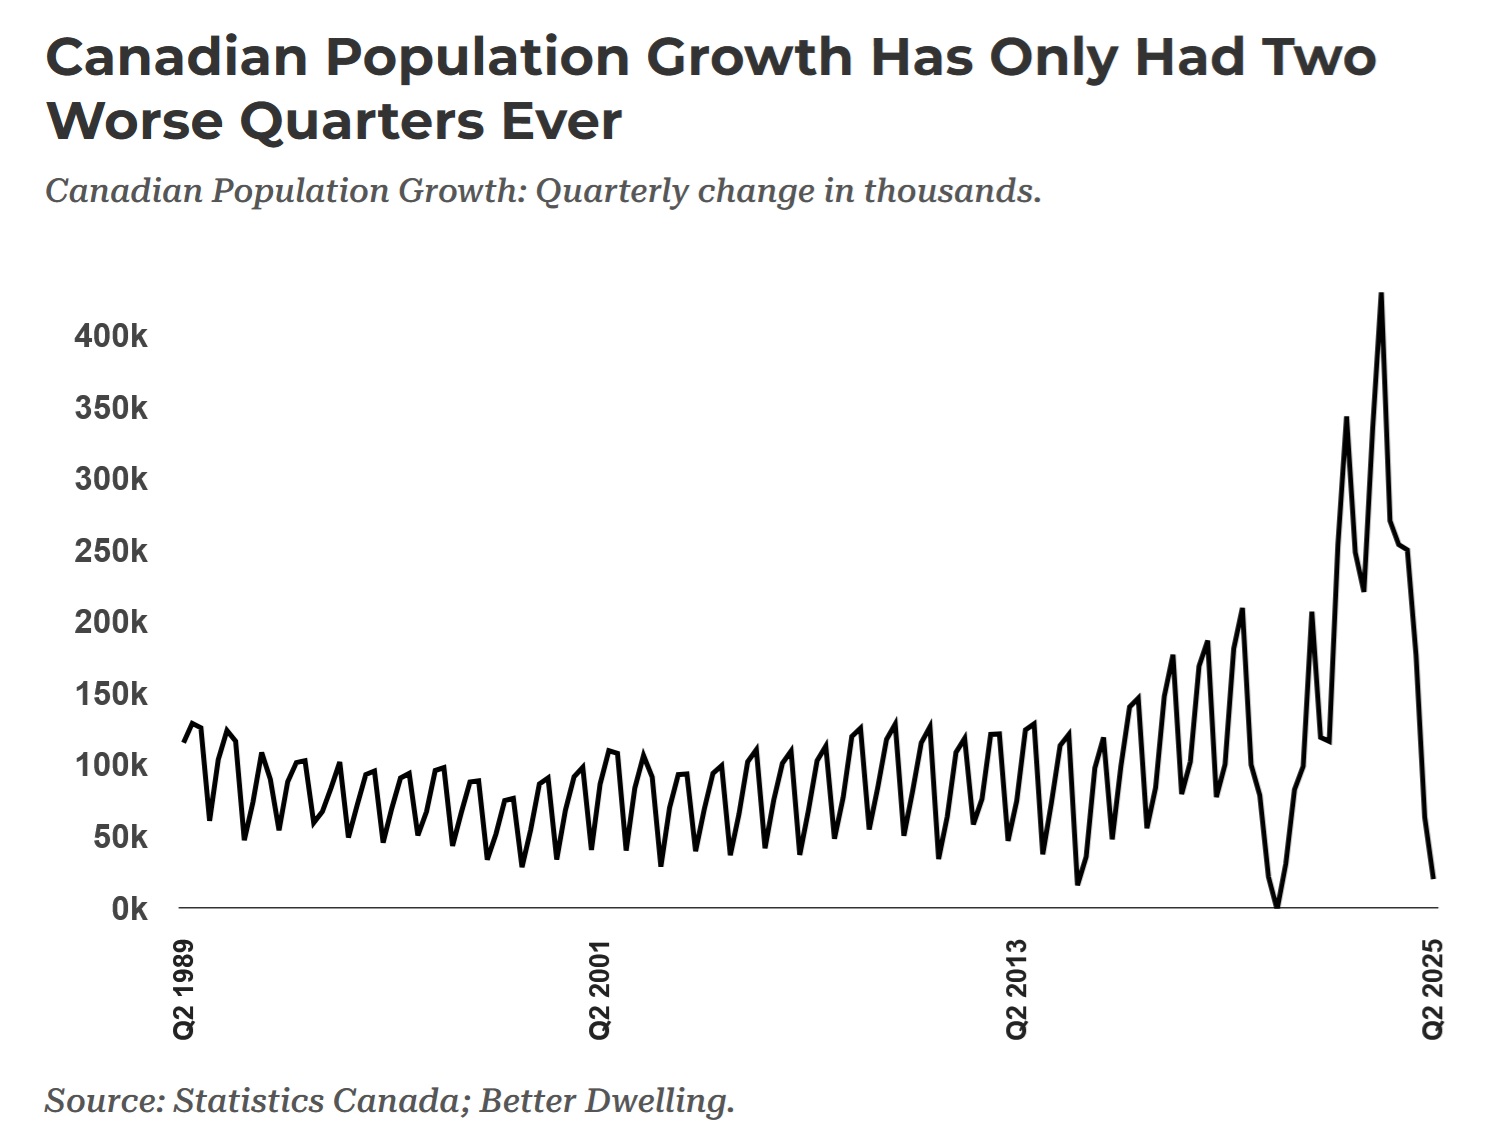
2. Development Pain
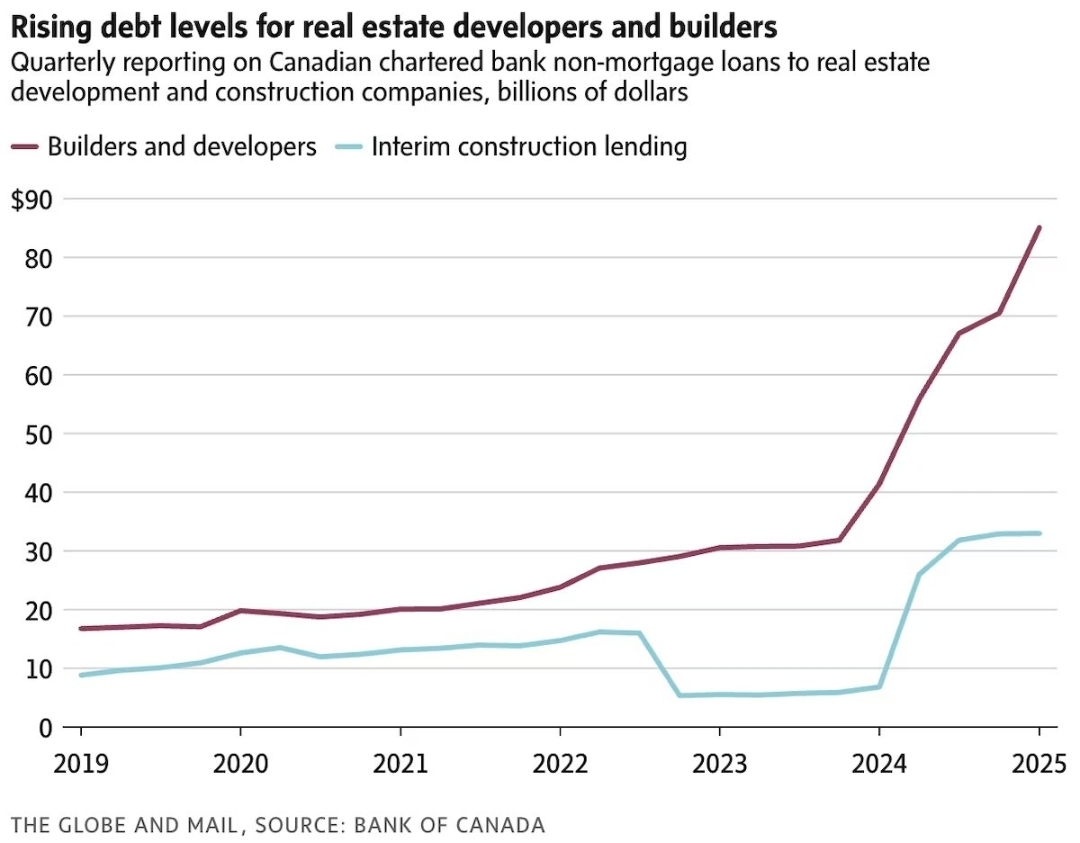
As Canadian real estate investor diminishes, the pre-sale condo sales plunge to new lows. Housing projects across the country are either being cancelled or delayed as they are no longer viable. As such, some of the biggest developers in Ontario and BC are racking up debt like a fast-ticking time bomb. In BC, news of overstretched developers go into receivership come up on a quarterly basis. As for the developers with a longer history and deeper pockets, they are left with nearly no option but to go on a firing spree. Rennie Marketing (BC's biggest pre-sale marketing company) and Wesgroup (one of BC's renown developers) had seen headline as they severely trim their work forces. These may be more common news as the pre-sale condo scene is not seeing a recovery anytime soon. (Source: The Globe and Mail, Bank of Canada)
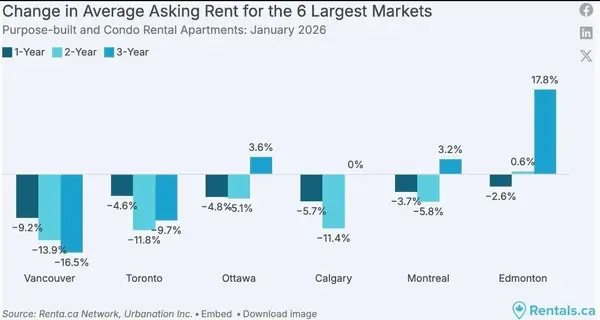
3. Keep On Falling
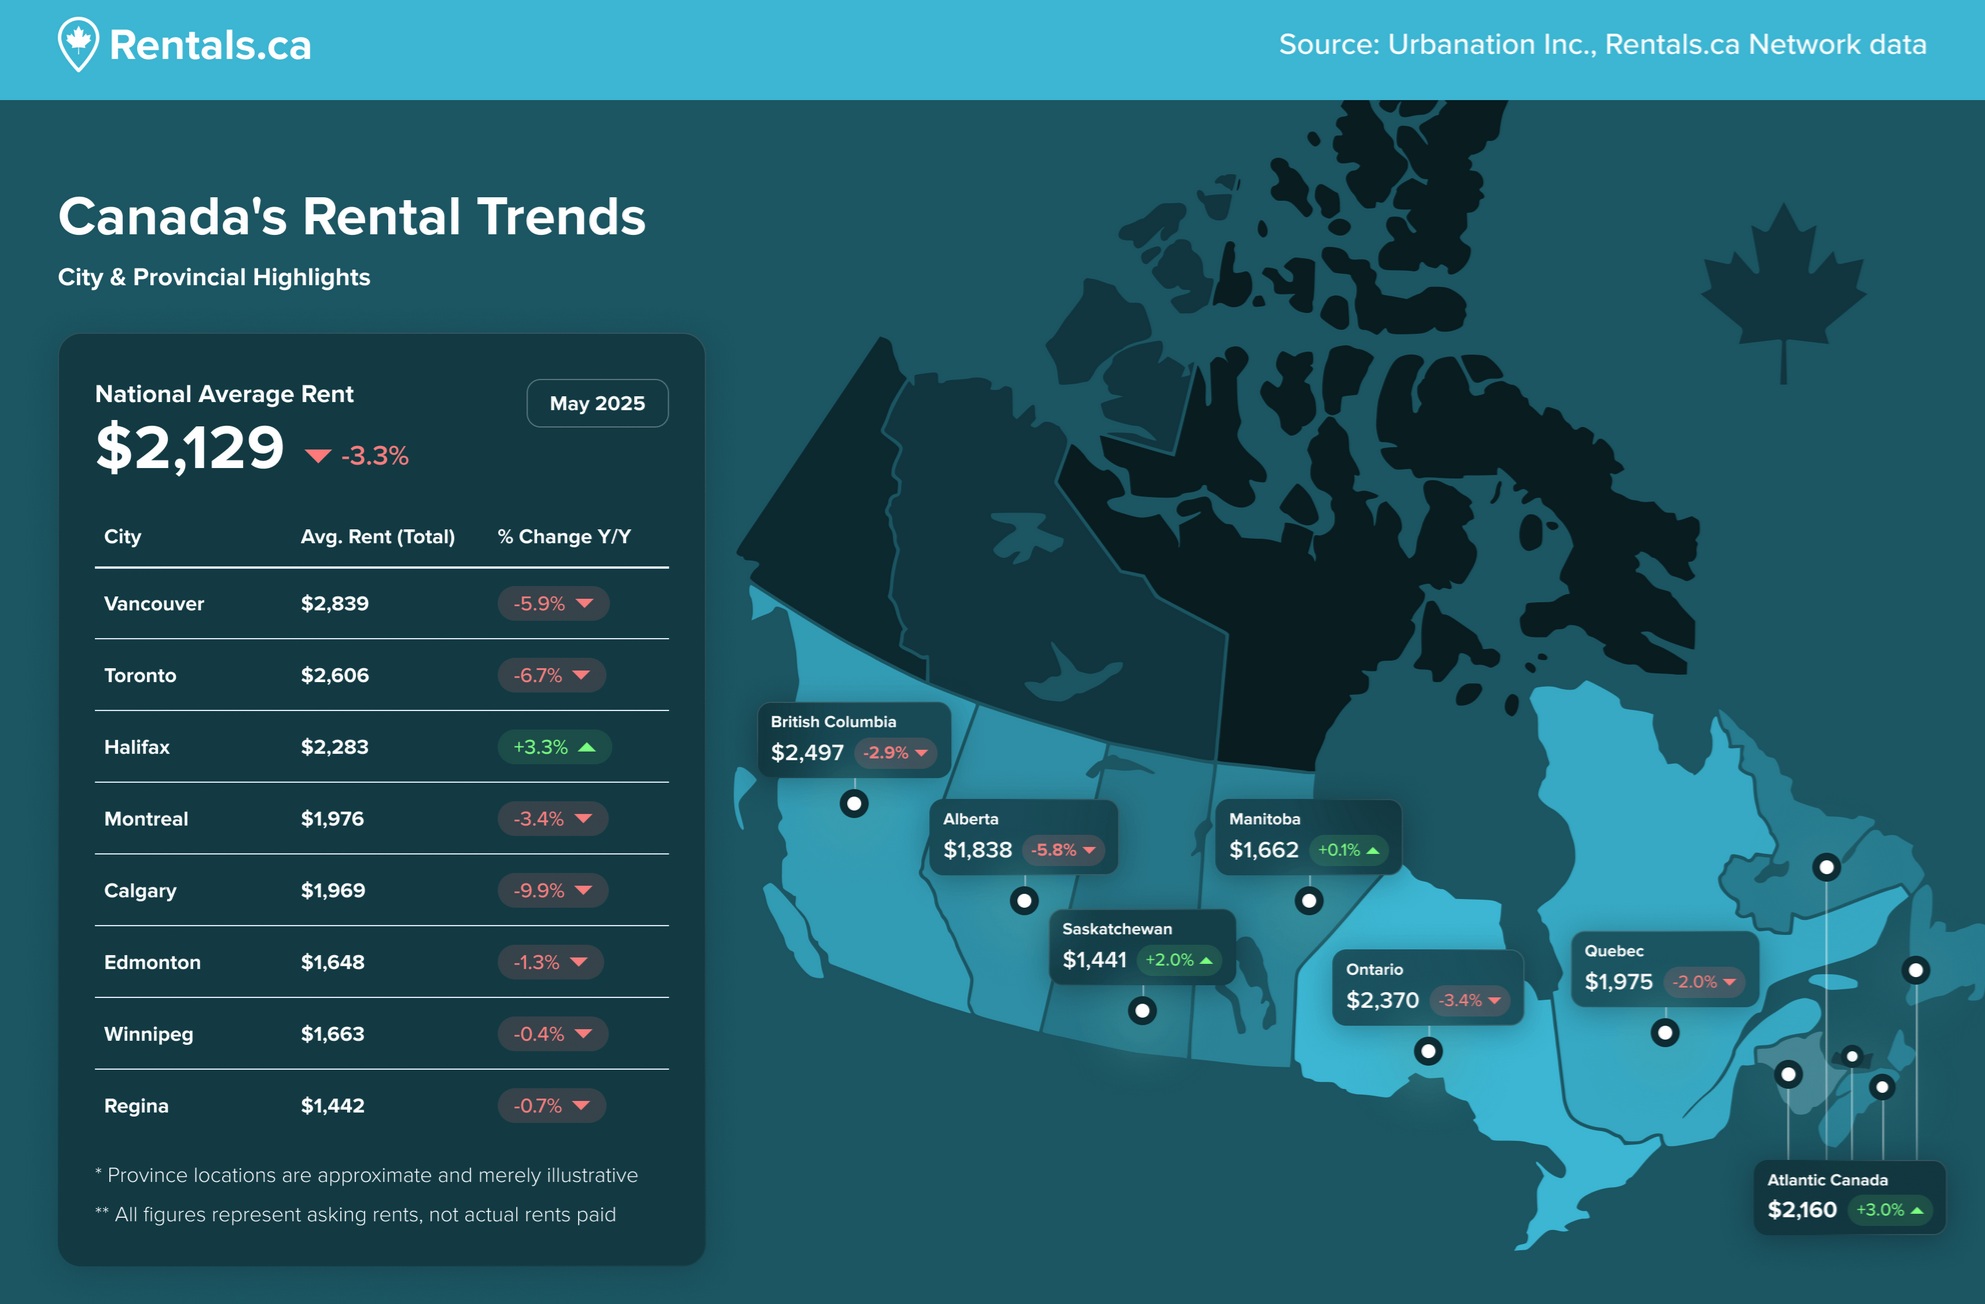
One of the knock on effects of net-zero immigration is falling rents. On top of that, the quality of the tenants is dropping. BC again takes the cake with the most expensive rent amongst Canadian cities, but this time it tops the list with the 4 cities: North Vancouver (1st), Vancouver (2nd), Burnaby (3rd) and Coquitlam (4th). Toronto, which was once 2nd on the list, has now slips to 5th. (Source: Urbanations Inc, Rentals,ca)
Recent Posts

GET MORE INFORMATION