

Real Estate Market Intelligence August 2025

Real Estate Market Intelligence
August 2025
The dog days of summer is here, and typically July and August are one of the slower seasons in Vancouver real estate. However, this year has been anything but typical; the busy (spring) season was not busy and the (summer) slow season is not slow. Spring had out the lowest sales in 20 years, while for the summer so far, July has registered a surprisingly month-over-month increased in sales. The last time that happened, it was during the height of the pandemic back in July 2020 when rates were cut to the bone at 0.25% and buyers were foaming at the mouth over homes. While July's one month sales uptick doesn't make a trend, but it was a rather welcoming change of winds after a dull Spring. So what changed? Again, lots to cover this month as we see Canada's July unemployment rate remained unchanged but with substantial job losses, rental rates continue to nosedive across Canada for the 10th straight month, and the latest inflation data possibly changing Bank of Canada rate cut decision. Let's take a deeper dive.
The Greater Vancouver Realtor (formerly Real Estate Board of Greater Vancouver) stated that "sales activity in the region turning a corner." Indeed there were more showings and offers, with sales "improving" to -13.9% below the 10 year average. For context, the same stat was -30.5% in May, so demand has "doubled". Having said that, May was one of the slowest months in 20 years, and so anything coming off a record low would be called a considerable improvement. In my opinion, the July market was unthawing a bit but still far from average. Market continues to be segmented, with price of apartments in Brentwood and Metrotown remain suppressed. On the flip side, single house in Ladner, Richmond, and Burnaby are showing signs of heightened activity. Key is, the total supply remains stubbornly high at 17,168 units, which is +40.2% above 10 year average. Again for context, an average of 10,000 homes is considered healthy and balanced, so we are 7,000 units above that now. All stats are pointing towards Sellers' willingness to come off the sidelines, and as these Sellers homes sit longer the market, more competition come on. Such Sellers, who are accustom to the Vancouver bullish market, is seeing their patience run thin. Imagine selling a home for 2 months with no offers, and then Seller reduces the price only to see a low ball offer and/or a subject-to-sale offer (i.e Buyer need to sell their home). The aforementioned scenario has been getting more common, and the frustration boils over for Sellers who are eager to move on. Personally, I don't see how this will improve until the supply returns to a balanced level. For the first two weeks of August, some of the noticeable developing micro trends include raw land single house being sold for a steep discount due to the fact that investors have disappeared, as developers have no appetite to build. Also, luxury homes near and above $3m are starting to sell after sitting for months, so we may be see a top-down movement there. As we edge closer towards September when there will be likely be a new wave of inventory coming on, it would be interested to see how the market would respond.
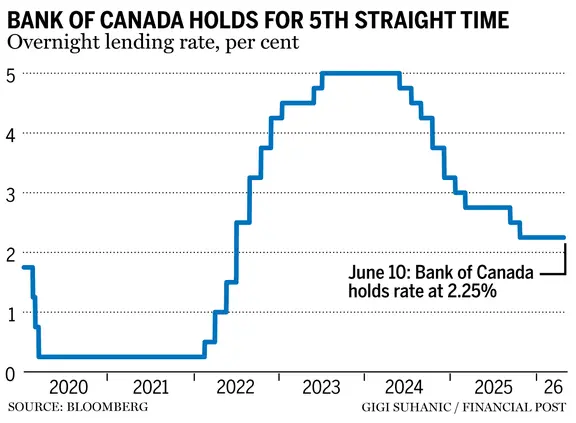
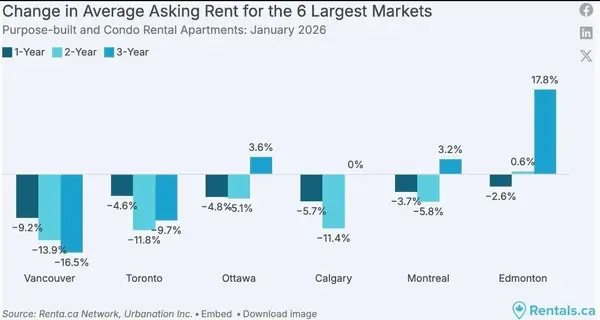
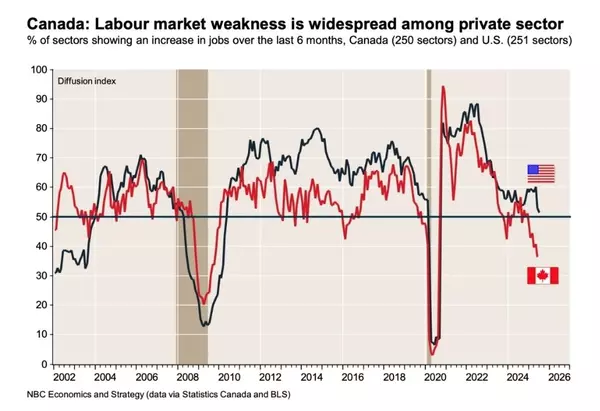
As for the Canadian economy, July's latest unemployment rate remained unchanged at 6.9%, but with a loss of -41,000 jobs along the way. Just a month ago in June, Canada gained +83,000 jobs. So when I see polarizing stats like these, I can't help but be skeptical on how the government is capturing such data. With that said, the Bank of Canada has been repeatedly asked about their upcoming policy rate decision. The Big 5 banks vary on their views, with some saying 2 more cuts, while RBC is stating the no more cuts. I am leaning towards the latter as I believe the Bank of Canada is still torn between a Canadian economy showing signs of resilience amidst tariff, and the fear of inflation lurking (July's inflation was 1.7%, with core annualized 3 months inflation rate coming below 3% for the first time in 3 months). Note that the lower inflation was mainly driven by lower gasoline prices and the removal of the carbon tax. On the real estate rental front, nearly all major cities in Canada are facing falling rent, with the largest year-over-year decline in Vancouver (-9%) and Calgary (-11.6%). As the Liberal government's housing policy continue to avoid the topic of affordability but keep pumping out more rental housing, compound that with a negative immigration, and it's not hard to imagine the rental rate will continue to fall. With the end of summer around the corner, September is poised to setup the tone Q4 for another possible wild ride. As the stock market continue to rip to an all time high, could that boost the confidence of some Buyers to return to the Vancouver real estate market? Let's see.
Some of the unique trends I've been observing:
1. The Vancouver real estate market in July enjoyed a surprisingly uptick in month-over-month in sales. Last time that happened, it was in 2020 during the height of the pandemic when rates were cut to the bone at 0.25% and the bidding frenzy was beginning. Surely the current situation is nothing compared to that, but it was indeed a pleasant surprise. Despite the jump in sales, it is still -13.9% below the 10 year average. Some may say this is a change of winds, while I believe it was simply Buyers waiting on the sidelines for 3, 4, or 5 months and finally getting fed up. Fact is, real estate remains a core human need: families will have kids (upsize) and members will pass away (estate sale or downsize). Such plans can only be delayed for so long before the urge and the need take over.
2. Canadian inflation dropped slight in July to 1.7% (down from 1.9% in June), with core annualized 3 months inflation rate coming below 3% for the first time in 3 months. While this is welcoming news, this drop was mainly due to lower gasoline prices and the removal of the carbon tax. Remember not long ago when Justin Trudeau and Chrystia Freeland said that carbon tax is not inflationary and refused to disclose how much was collected?
3. The Premier of Toronto, Doug Ford, has been vocal and advocating to the Bank of Canada to cut rates as soon as possible. As we know that Ontario is the hardest hit province from the tariffs and the economic downturn, from manufacturing to real estate pre-sale, there is no escape. However, did Doug think that inflation will magically go away with rate cuts? Would we like a $50 steak to go up to $60-70? He may be looking to save a few industries, but not everyone else.
4. BC and Ontario's pre-sale market is in absolute cleansing mode right now. Buyer confidence on these future markets remain near all-time low, and looks to stay there. Keep in mind that nearly all major developers has stopped building, we will hit a complete halt in new, for profit, construction by 2027. I could only imagine when the government relaxes the immigration policy and by then, we could go from one crisis to another.
5. Canadian rental rates continue to trend lower for the 10th straight month, with BC and Calgary's leading the pack with year-over-year change at at -9% and -11.6% respectively. As CMHC (Canadian Mortgage Housing Corp) has such a success in subsidizing the construction of rental housing program, I could imagine the downward trajectory of rent to continue. The ones continue to get hurt are the mom-and-pop investors, who bleed negative cash flow with the further rising strata fees, property taxes and falling rent.
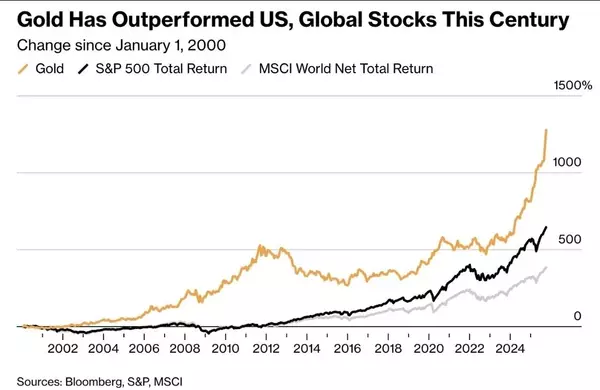
6. There seems to be no stopping the stocks market and bitcoin as they continue to break records. Will these investor confidence spill over to the real estate market and help with the recovery soon?
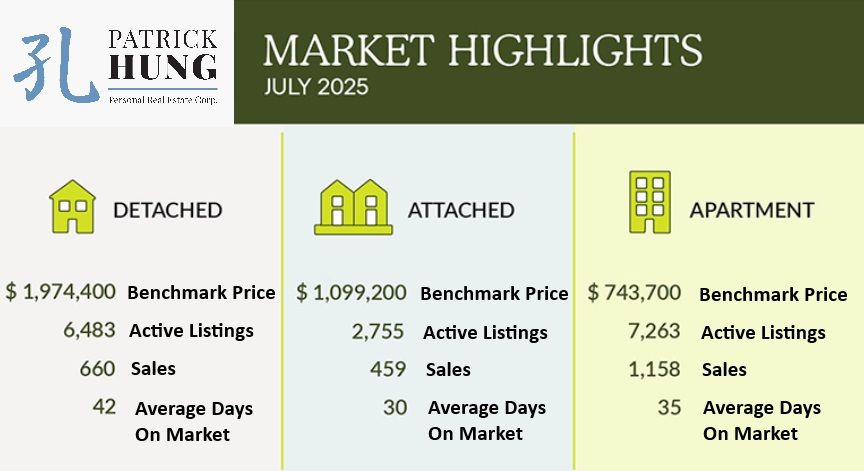
Here are the 3 highlights for July:
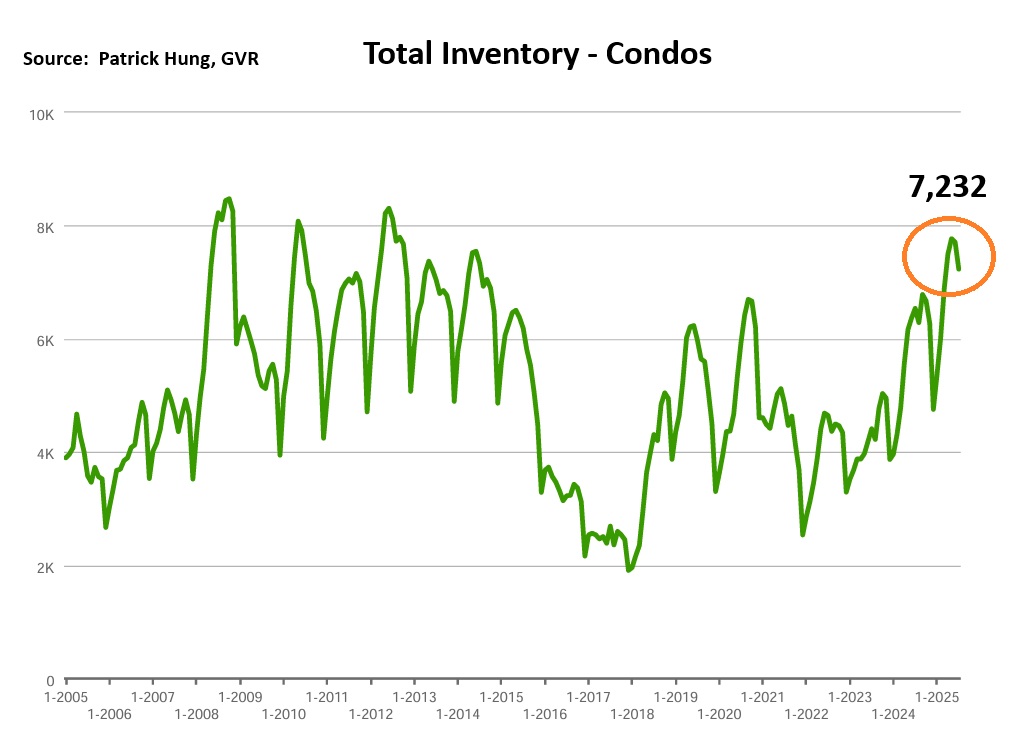
- Total inventory of 16,905 units is the highest July total inventory since 2014. However, it has come down from the 17,000 unit highs from May and June.
- August sales continue that of July, with the first two weeks seeing increased activities. It remains to be seen whether those activities translate into sales.
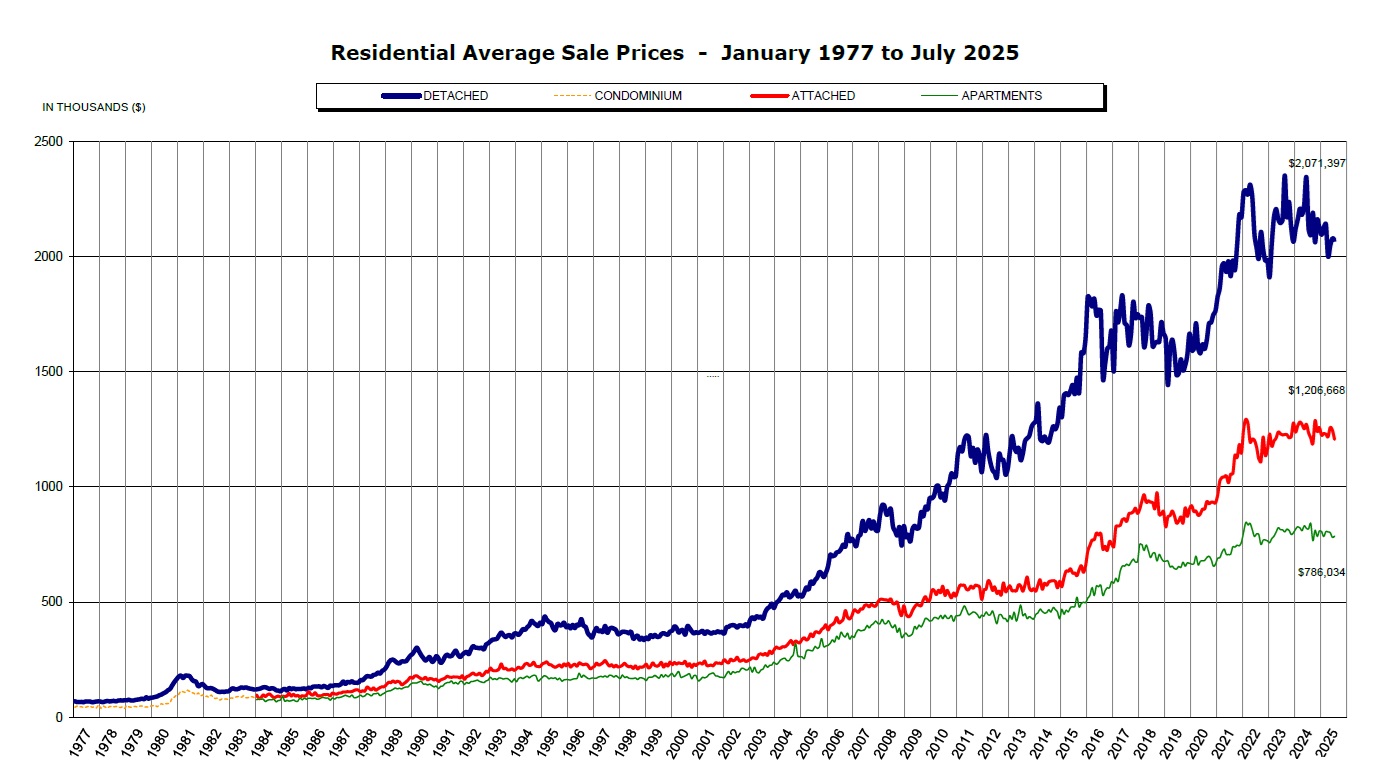
- Prices slipped slightly again last month by -0.7%, with the average price slipped by -1.6% in the past 3 months. The majority of the monthly price drop came from single houses as -1%, whereas townhouse saw the least drop at -0.4%.
Here are the in-depth statistics of the July:
- Last month's sales were -13.9% below the 10 year July's sales average.
- Month by month residential home sales surprisingly increased by +4.2% from June 2025.
- Month by month new home listings dropped by -11.3% compared to June 2025, again due to seasonality.
- Last month's price dropped further by -0.7%.
- Sales-to-listing (or % of homes sold) ratio is increased slightly to 13.8% (compared 12.8% in June). By property type, the ratio is 10.2% for single houses, 16.7% for townhouses, and 15.9% for condos.
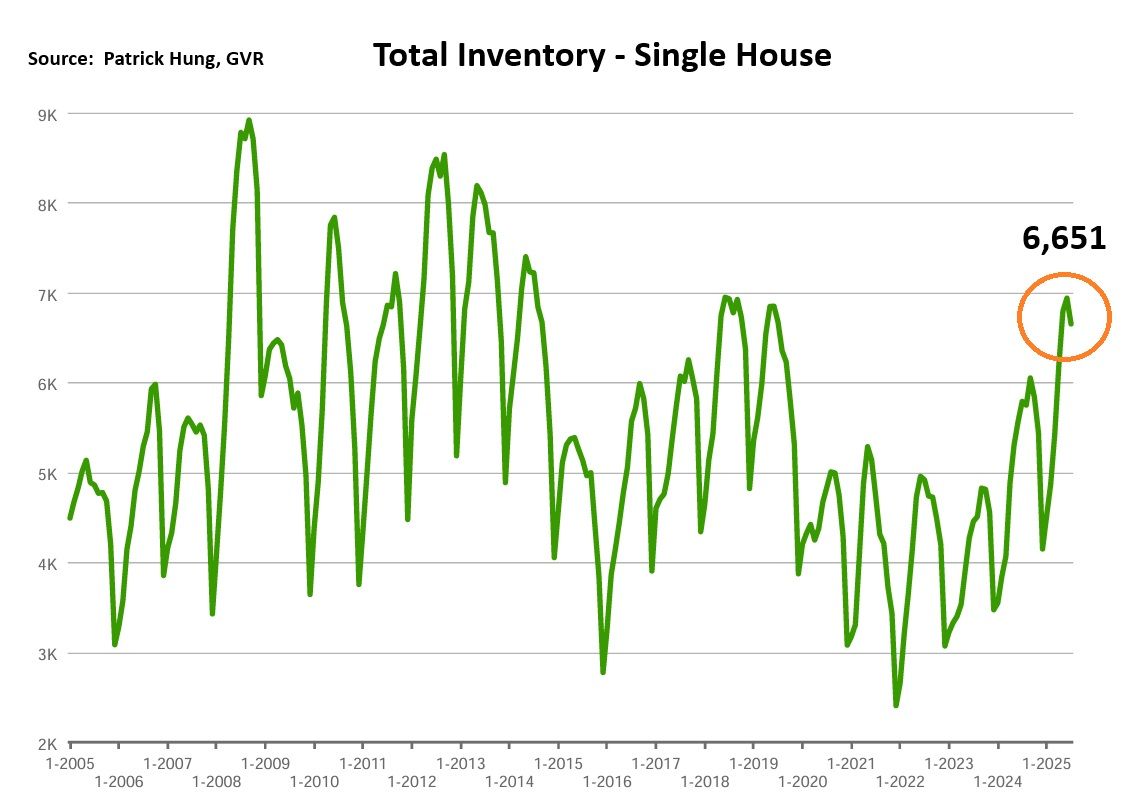
In July, the single house market sales has evidently picked up the pace. Total inventory shrank by 4.1% (due to seasonality), while sales maintained it pace from June. Anecdotally, we see the micro-trends such as the luxury home market of over $3m+ starting to move, and while this may be just a blip on the map, it could be a top down movement this time. Another micro-trend we're seeing is that the fantastic deals of these single houses were not displayed by a low asking price. In fact, it was an average asking price, but jaw-dropping sold price, that caught my attention. This tells me that Seller's fire-sale motivation is hidden. They don't want to attract low ball offers, but somehow have caved after being on the market for many months. Once that fire sale switch in ON, we started seeing occasions where homes were sold $300k-$400k below assessment, and in one instance, a single raw land in Richmond sold for $900k below. This was hardly seen in the past decade, and it tells me it truly is a great time for Buyers who are financial capable and with deeper pockets to get in. Overall, the single house market remained polarized, again with entry level homes around $1.6m being the popular ones and attracting the most traffic, while homes between $2m-$2.5m are still stuck. Suburbs such as Richmond, Burnaby, and New Westminster all remain in the Buyers market, with sales-to-listing ratio at 9%, 10%, and 10% respectively. Meanwhile, North Vancouver and Ladner remains attractive and is in Seller's market, with sales-to-listing ratio hitting 21% and 23% respectively. It feels like the single house market is finally starting to move after hearing crickets for 6 months., but it's still too early to tell.
For the month of July, the neighorhoods that registered most price growth were New Westminster, Burnaby East and Ladner, posting +4.7%, +4.5% and +0.8% respectively. Conversely, the neighborhoods registered the most significant price drops were Tsawwassen, Vancouver West, and Pitt Meadows, with -3%, -2.6% and -2.1% respectively. The single house market continues to be in a Buyers market for the seventh consecutive month, with average days on market increasing to 42 days (compared to 36 days in June), and month-to-month average price dropped by -0.7% (compared to -0.1% in June). Sales-to-listing ratio (% of homes sold) increased slightly at 10.2% (compared to 9.9% in June).
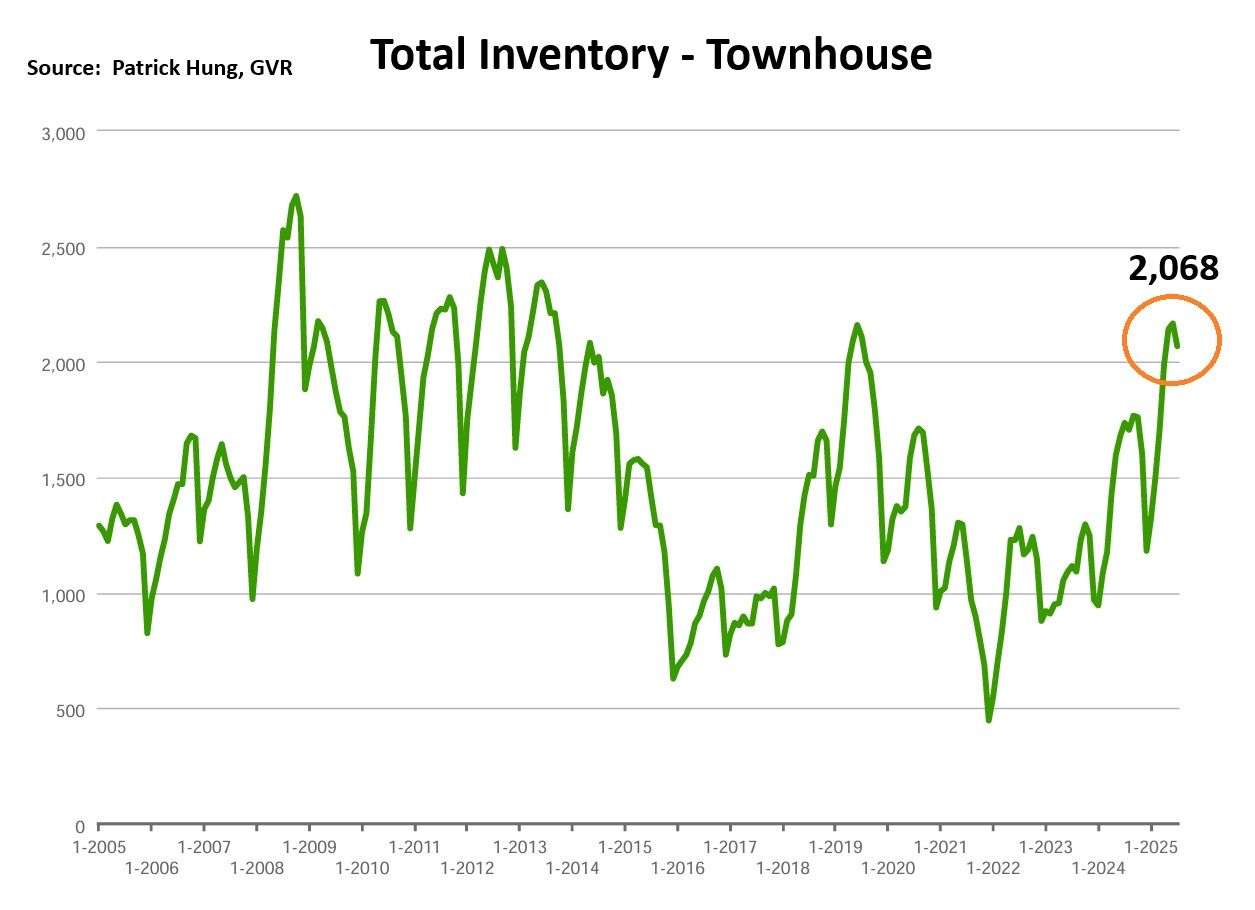
The townhouse market seem to be the most stable market on it all, with monthly price change of -0.4% being the best performing segment (single house is -1% and apartment at -0.6%). Digger deeper, we are seeing monthly seasonal sales dropped by -4.5%, while total inventory dropped by -4%. In other words, we are starting to see the townhouse marketing chopping sideways with sales nearly equalling demand. However, townhouse sales was the only segment that registered a sales drop (compared to single house's flat sales and apartment's increased sales), so is something not adding up? Anecdotally, we are seeing increased traffic but that has not translated into more offers. This could be due to a lagging indicator. For example, if an apartment Seller has just accepted a subject-to-sale offer, they would be actively engaged in the market in case it goes through. Having said that, they cannot commit to anything until that sale settles. As we know that townhouses are the primary choice for apartment seller to upsize, and so when the apartment segment's monthly sales improved by +9.7% in July, it isn't hard to see why that traffic would trickle over to townhouses. Having said that, there is still resistance for premium townhouses in Vancouver priced over $1.5m, and in the suburbs (i.e Burnaby, Richmond) priced over $1.2m. Entry level homes remain the dominate force, so the townhouse's bottom-up trend continues.
In June, the areas with the most townhouse price growths were in Ladner, New Westminster and Tsawwasen, registering +2%, +1.5%, and +1.4% respectively. Conversely, the neighborhoods with the most significant price drops were North Vancouver, Pitt Meadows and Squamish, at -2.8%, -1.8% and -1.5% respectively. The townhouse market remained in a balanced market with days on market increased slightly to 30 days (compared to 29 days in June). Month-to-month sale price slipped slightly by -0.4% (compared to -0.3% in June). Sale-to-listing (% homes sold) ratio remained nearly flat at 16.7% (compared to 16.9% in June).
Condo Market
The condo market saw the most surprising change in July, where there were a monthly drop of -6% in total inventory, but sales had shot up by +9.7%. After months of constant bombardment of new supply but very slow sales in this market, there is finally some churn. Having said that, July's total apartment inventory of 7,381 units is still the highest for the month since 2012. This segment is definitely not out of the woods yet, and in my opinion, far from it. The once investor-heavy neighborhoods, such as Brentwood, Metrotown, Central Richmond, Guildford Surrey, and Willoughby Langley remain some of the hardest hit areas. With boots on the ground, I see the apartment showing activities has increased, and some of that does indeed translate into sales. There were rare occasions where listings, which are entry level and competitively priced, got sold within two weeks. After monthly of remaining stubborn and holding firm onto their asking prices, some Sellers have finally come to the sense of accepting the market as it is, as though they had gone through the cycle of grieving: denial, anger, bargaining, depression and acceptance. Whether they like it or not, the market will continues to shift and adjustments will need to be done. There are still a lot of pre-sale that will be completing before end of 2026, which means they will be facing competition in the same space as re-sale units. Compound that with developers unsold inventory, and it's not hard to see the oversupply problem to persist till 2027. But after 2027, apartment Buyers will see new construction fall off a cliff (where it all stopped in 2022/23). Perhaps it may take until 2027-2030 before the apartment market really comes back to normal levels. But before then, apartment Sellers will need to be even more adaptive.
For the month of July, the best performing neighbourhoods for apartments were mainly in the outskirts of Squamish, Whistler and North Vancouver, at +1.4%, +1.3% and 0.2% respectively. Conversely, the areas with the most significant price drops were Ladner, Tsawwassen and Port Coquitlam, posting -3.1%, -3% and -2.4% respectively. The apartment and condo segment remained in a balanced market, with average days on market flat at 35 days (same as June). Month-to-month sale price continue to slip at -0.6% (compared to -1.2% in June). Sale-to-listing (% homes sold) ratio also shot up slightly to 15.9% (compared to 13.9% in June).
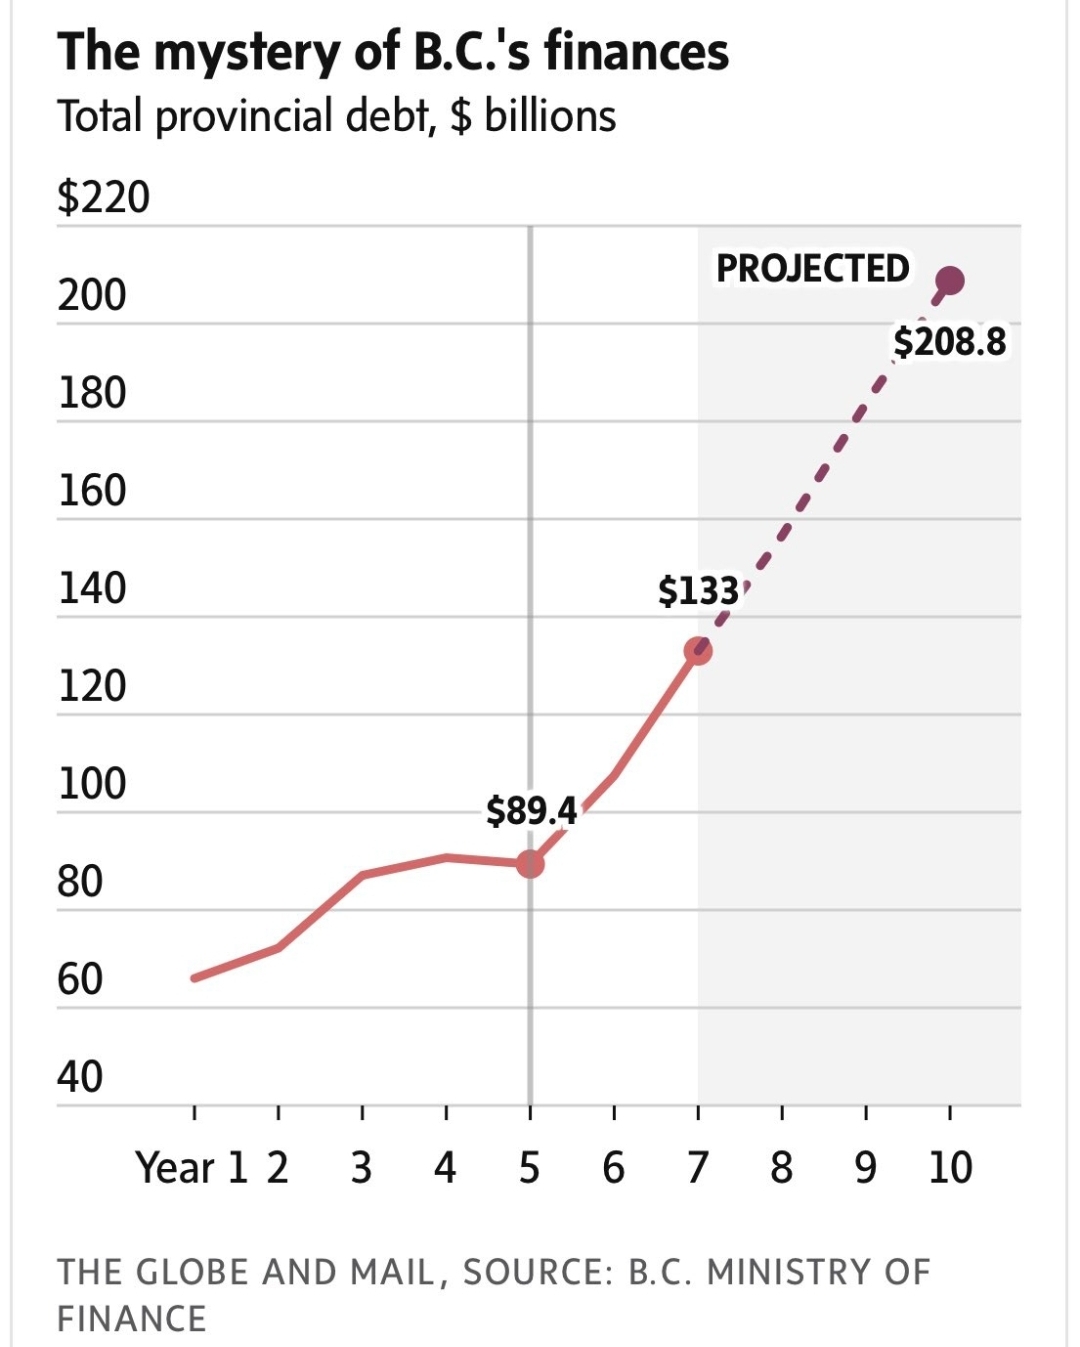
1. NDP Hole
Much like the Liberal government who still haven't tabled an budget, but is widely expected the annual deficit to balloon to around $93 billion, the NDP government is definitely following those footsteps with racking up an astonishing $133 billion on the 7th year, and project to eclipse the $200 billion on the 10th year. Ontario is also on a similar trajectory. With the federal government and the two largest provinces going deep into debt, just how else can the government lower these debt without raising more taxes? And when they do, how would we just expect our next generation to have a better life, or perhaps they would just leave Canada altogether? (Source: The Global and Mail, BC Ministry of Finance)
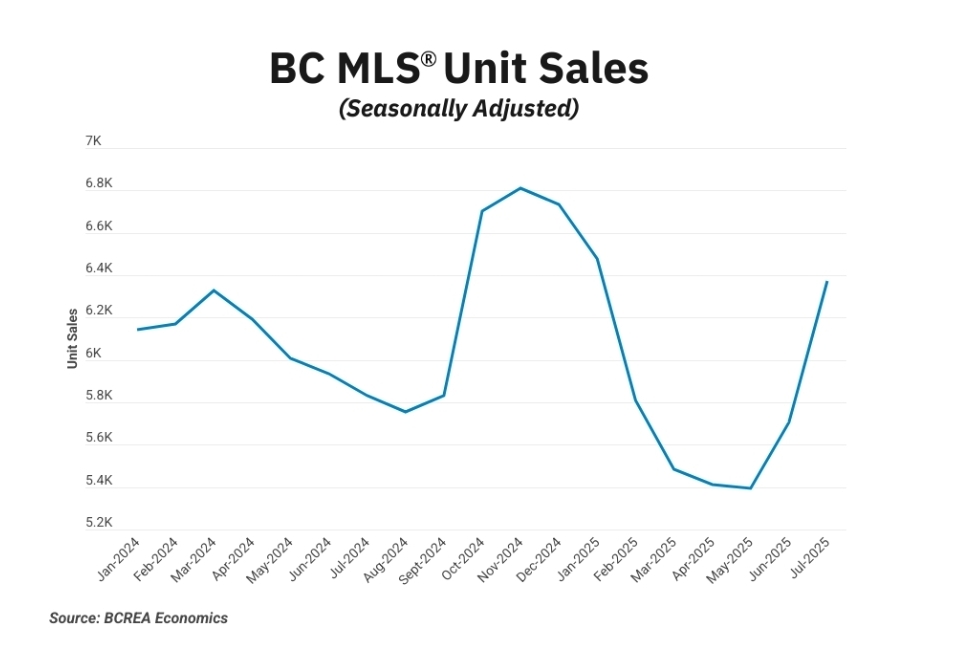
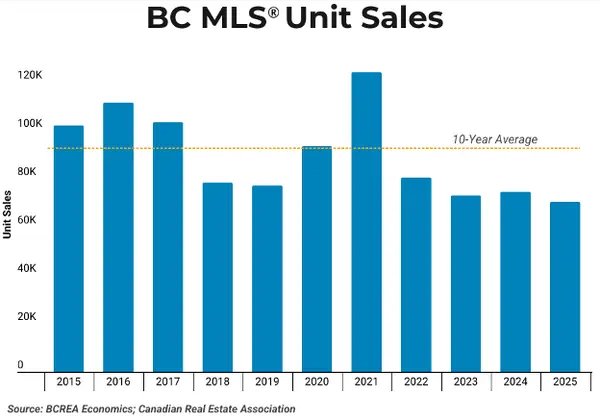
Back in June, the Greater Vancouver Realtor (former Real Estate Board of Greater Vancouver) stated that sales are showing signs of "turning a corner". While it was too early to tell, July continue that trend. August upcoming sales stats could further solidify that, but the next true test would be in September, where it is usually the last push for Buyers and Seller to come together before year end. (Source: BCREA Economics)
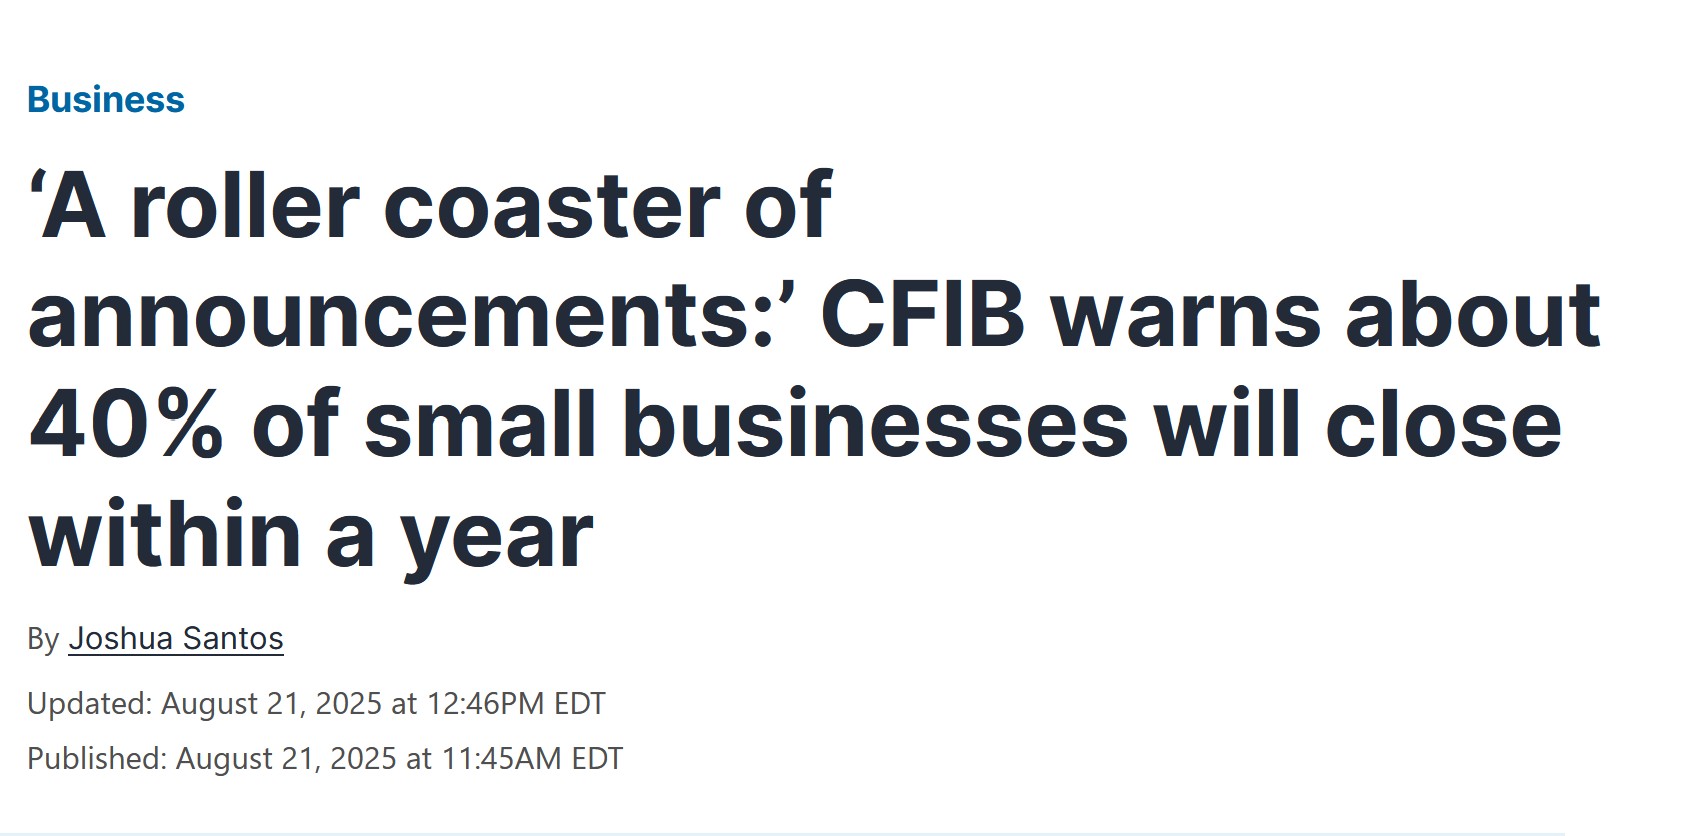
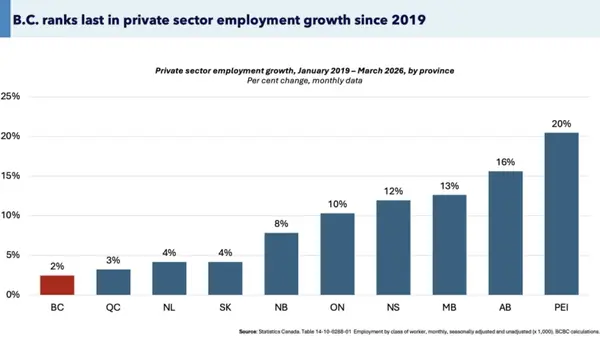
Accordingly to the Canadian Federation of Independent Business (CFIB), 40% of small business could close in Canada within a year due to the tariff. In BC, that number is approx 20%. As such business closure isn't abrupt but a slow burn process, so these "pending" closures won't show up in the unemployment data till 1-1.5 years later. Also, once these small business are gone, they're gone for good, and commercial real estate may be faced with more vacancies. Even when the current federal stats are show signs of Canada's economy resilience to tariffs, the truth lies in the near future ahead. Source: (CFIB, BNN Bloomberg)
Recent Posts

GET MORE INFORMATION