

Real Estate Market Intelligence April 2024

Real Estate Market Intelligence
April 2024
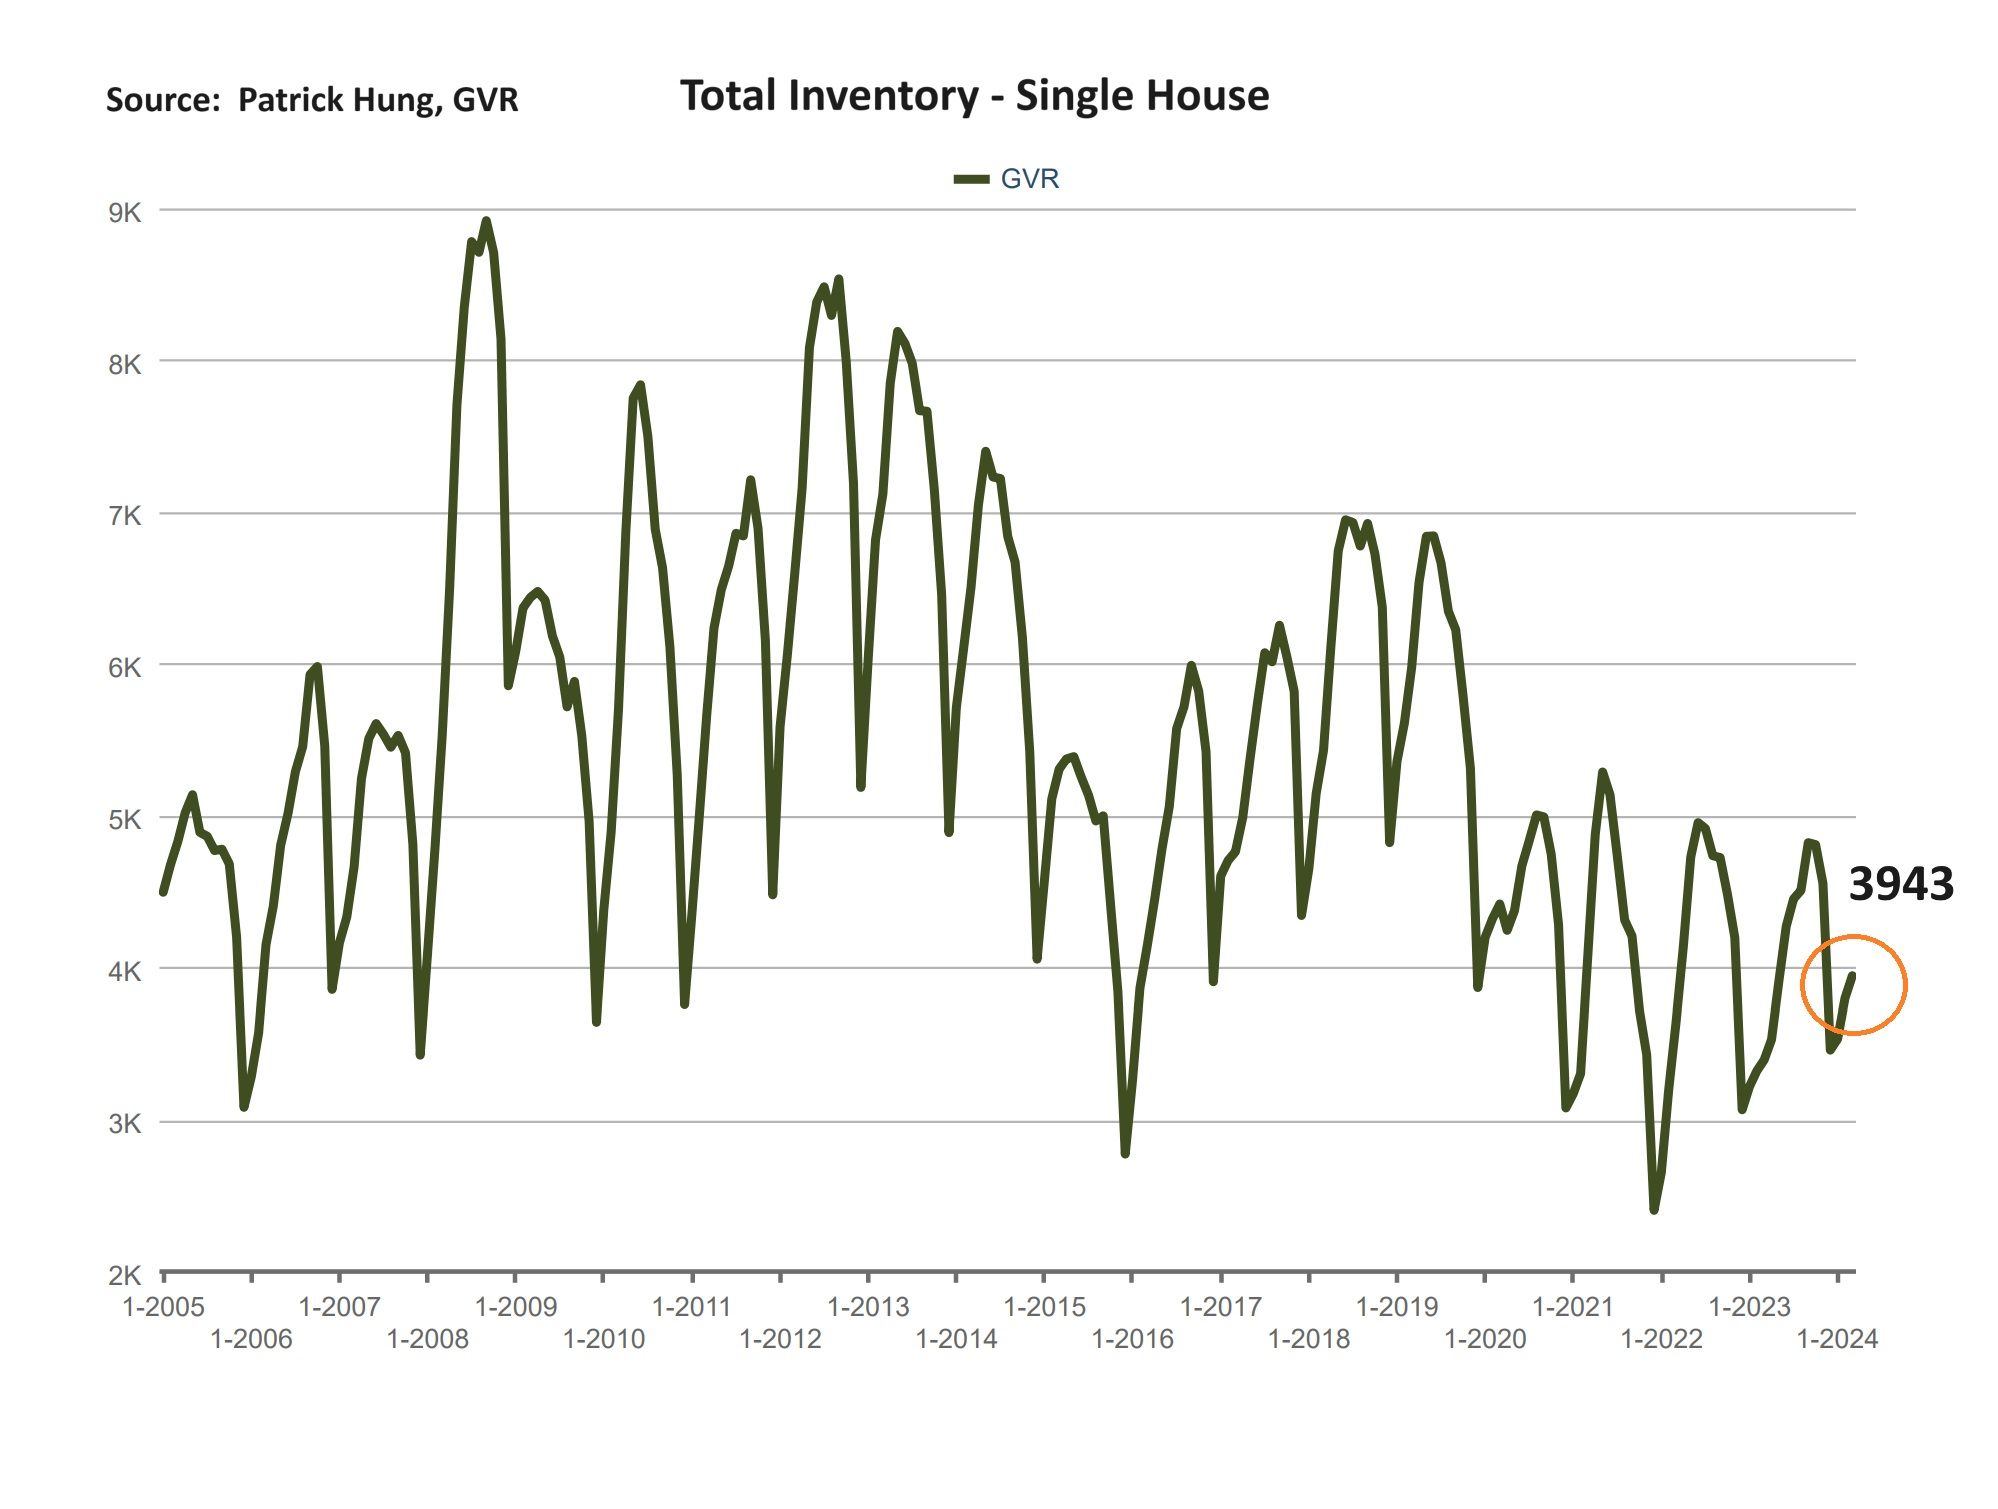
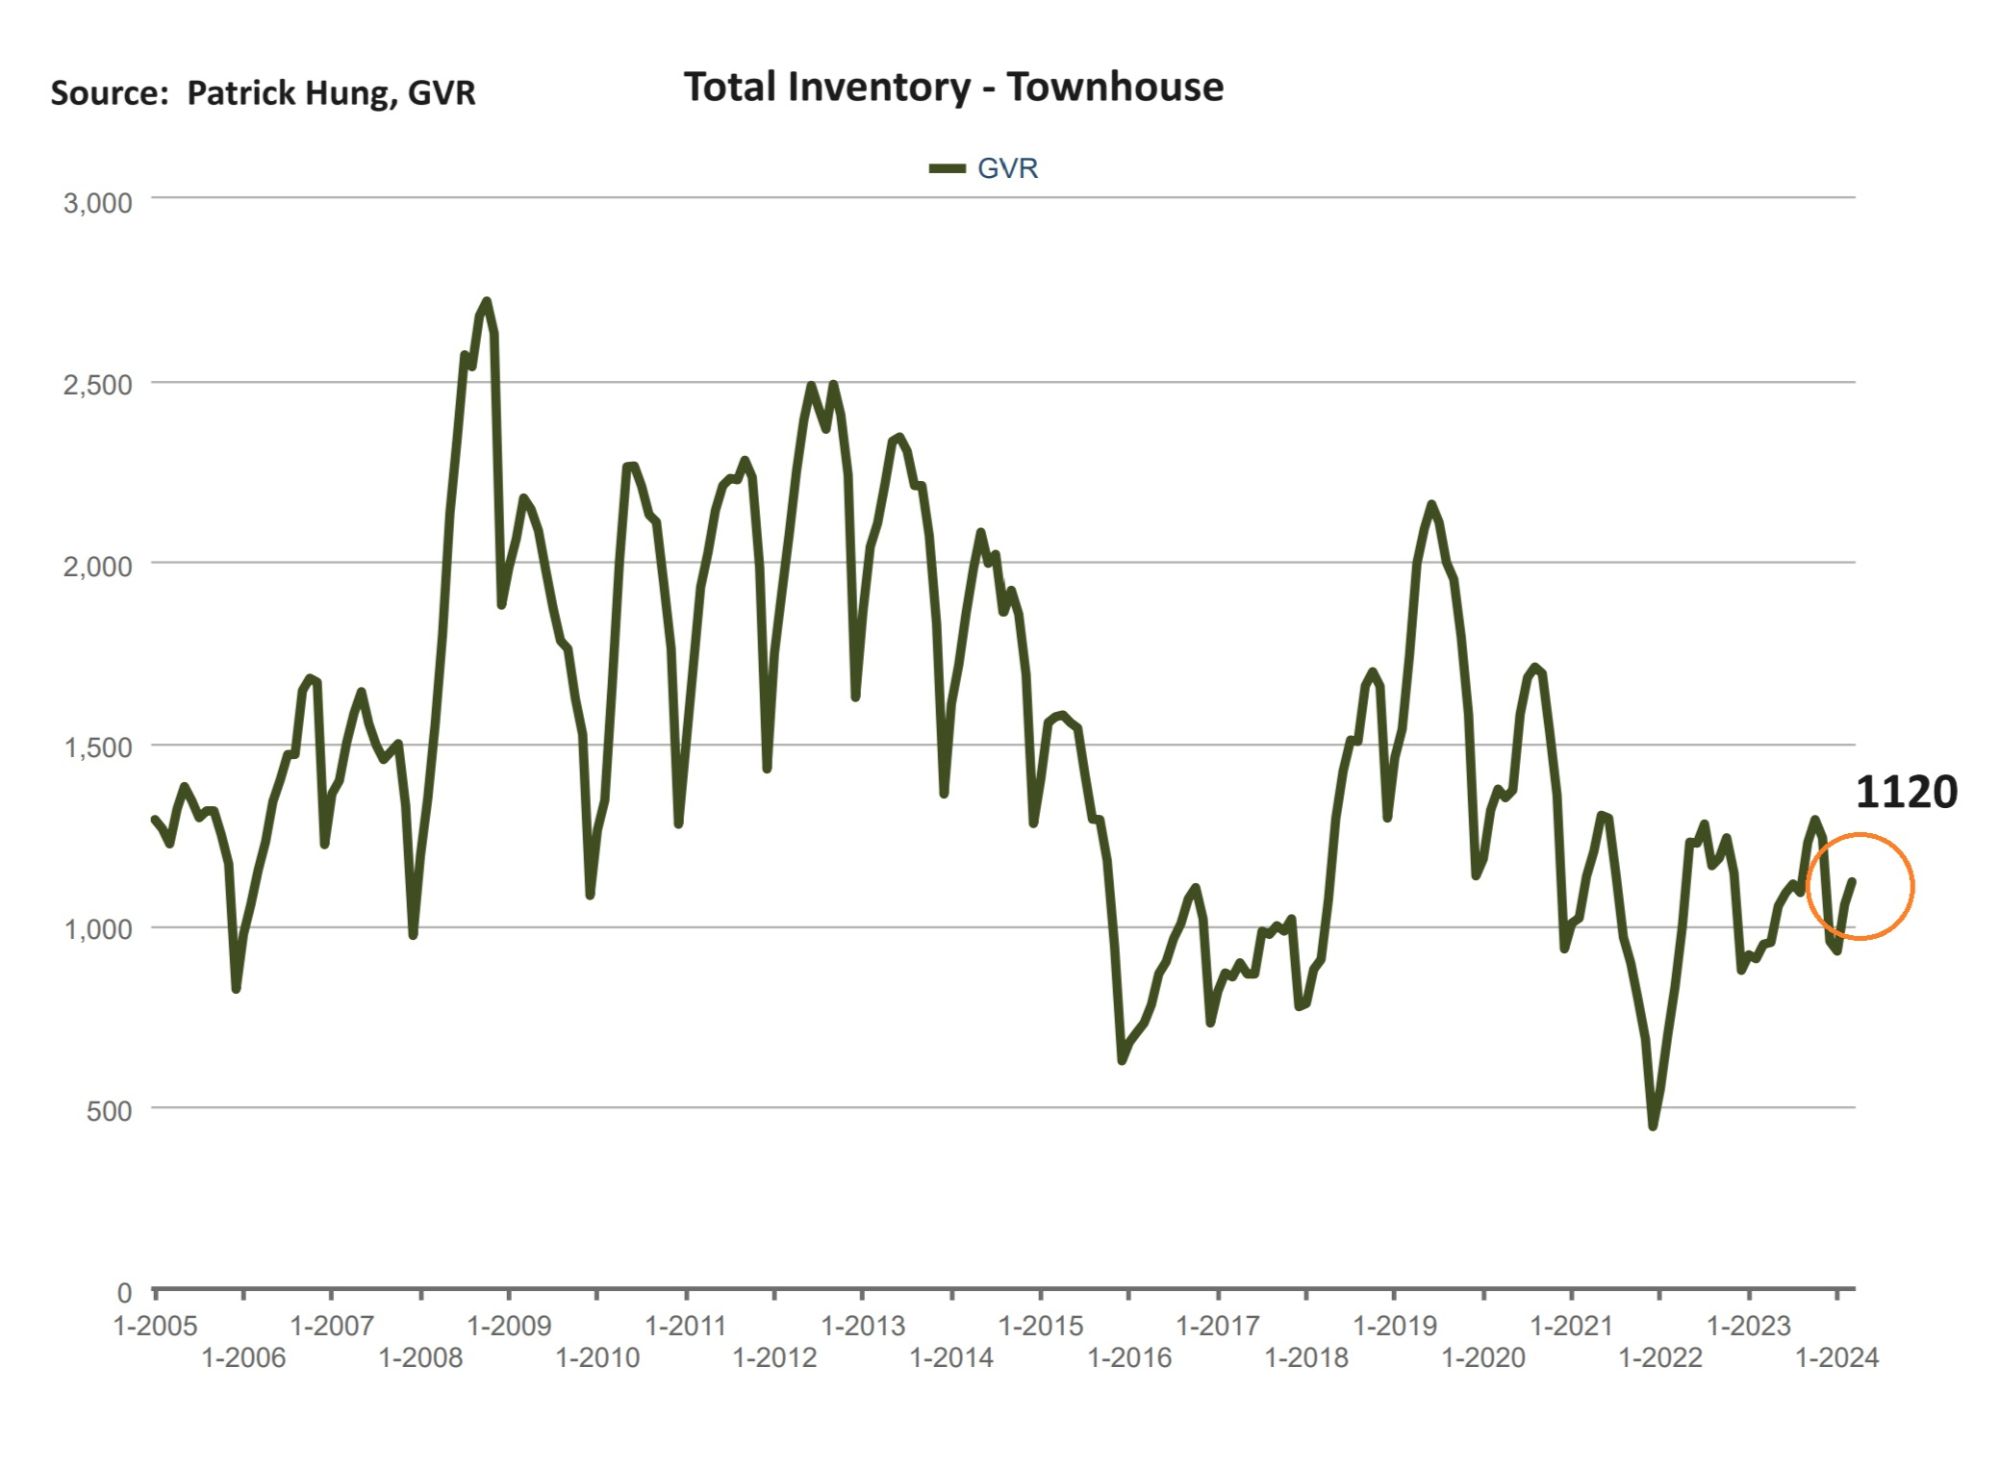
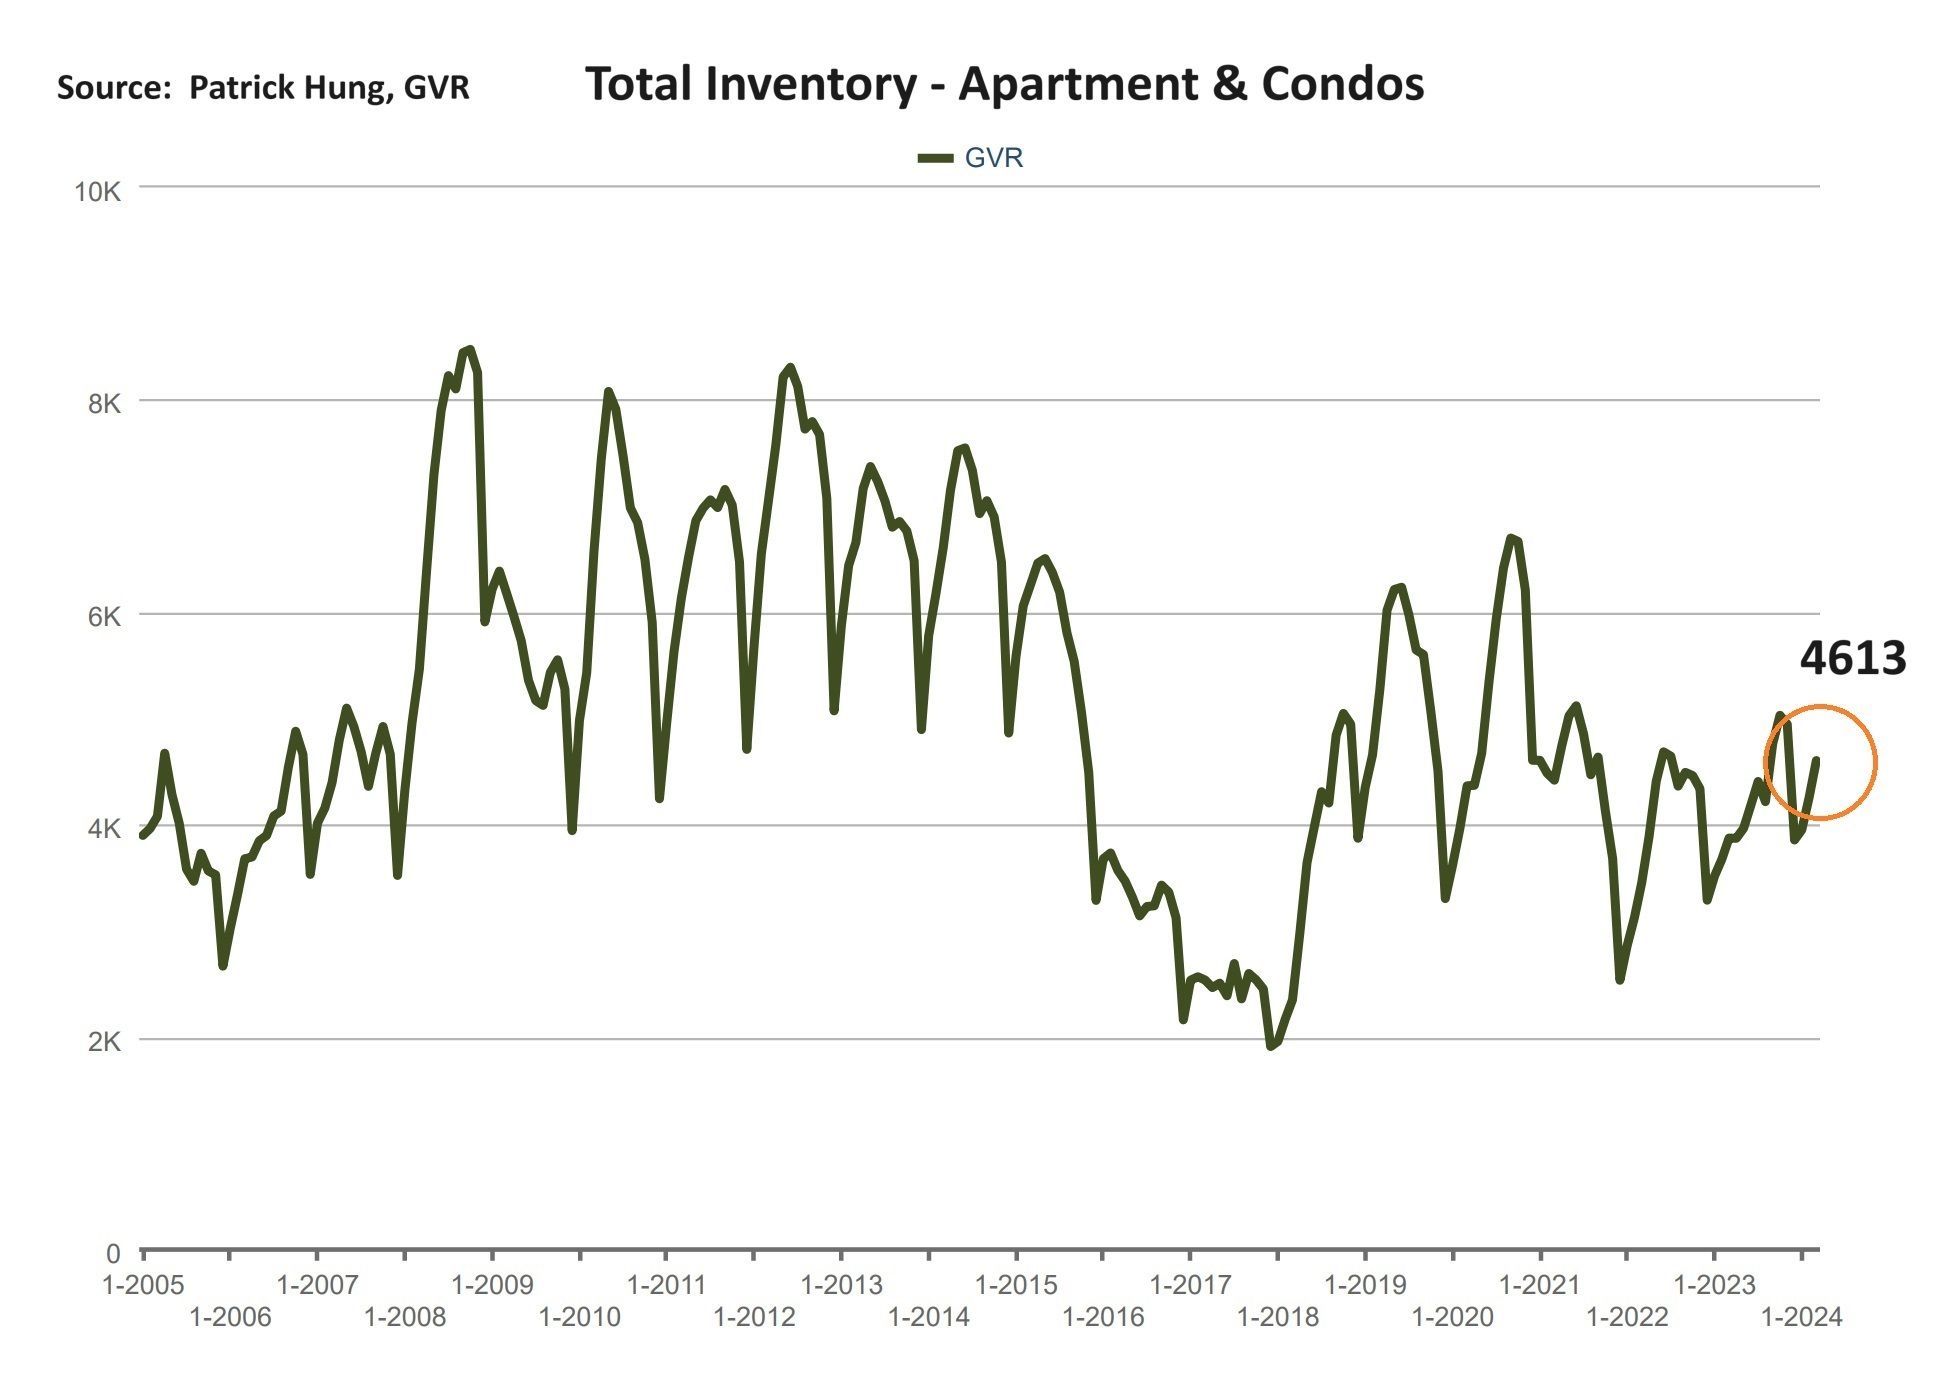
The Vancouver Spring weather is upon us, and as we bounce between warmer and cooler days, the March real estate market was a bit like that too, with some stronger stats and some really weak ones. For example, the total inventory has shot up +6.3% above the 10 year average. This is great news for Buyers, right? Along those same lines, March total sales was also really weak, sitting at -31.2% below the 10 year average. Just when most stats are pointing towards weaker demand, the month-to-month prices went the other way and popped up by +1.1%. In other words, sale are down, inventory is up, but prices are not coming down but going UP? Somehow, this is defying logic and common sense.
All this is very confusing for both Sellers and Buyers, and that just shows how hard it is to navigate in the current Vancouver real estate market. Polarity in segments are becoming extreme. Apartments Buyer enjoy new listings that has increased by +7.5%, while the single houses Buyer are still stuck in a Seller's market with new listings merely increased by +3.6%. Overall, the market has shifted quickly from a balanced to a Sellers in spring, with much more Buyers coming out off the sidelines. The townhouse and single house segments are tougher for Buyers as inventory is still not enough to meet demand. For example, in Greater Vancouver, most entry level single houses under $2m either have a multiple offer, or are usually sold less than 2-3 weeks. Apartments under $600-700k are still a hot commodity (except Downtown where the market has not recovered from the pandemic.) I was frequently asked: "How's the Spring market?" and my response is that it's a mixed bag. Sales ratio (% of homes sold) of apartment and townhouses in North Vancouver is 42%, compared with Vancouver Westside, which is only 13% (that's a whooping 29% difference!) Overall, the Vancouver real estate market no longer rhymes or reasons, but simply ebbs and flows between segments and neighbourhoods.
As for Canadian real estate politics, Justin Trudeau has just released the Bill of Renter's Right, which is aimed to introduce a national leasing agreement, and implement requirements for landlords to disclose previous tenant's rental price. In my opinion, this policy is another false advertisement that helps no one. Firstly, all leasing agreements are regulated on the provincial level, and if the federal government would want a national leasing agreement, they will have to override all the provinces, which is like pulling teeth with all the provinces premiers and create all sorts of legal issues. Secondly, disclosing the previous tenant's rental price has absolutely nothing to do with the current rental market price. Just imagine, how would the rent of a tenant from 4 years ago affect the new tenant's rent? This policy show how out-of-sync the policy-makers are with the Canadian public.
On the economic front, the Bank of Canada's latest announcement lastweek of rate hold comes as widely expected. The anticipation of rate cuts in June is high, and I do believe that Canada will need to cut to calm the crowd. With Canada's latest unemployment rate hitting 6.1%, it may look okay on the books, but in the real world, it does feel the average Canadian is finding living hard now than 3-4 months ago. Looking around, I see more restaurants and retails running out of business than new openings. Big companies like Canadian Tire and Lowe's are struggling too as some their locations shut their doors for good. This is a sign that the elevated interest rates are not only hitting small to medium business, but big corporations are hunkering down too. Moving forward, there still needs to be convincing stats (such as inflation under 3%) in the next few months in order for Bank of Canada to expedite the rate cuts. However, with the recent surge in gas prices and combined that with the elevated carbon-tax, it would remain an uphill battle to tame inflation. Rate cut or not, 2024 has so far been a year of volatility, and key is to position ourselves accordingly.
Some of the unique trends I've been observing:
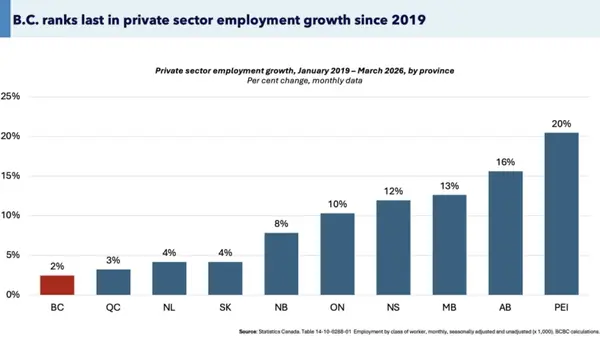
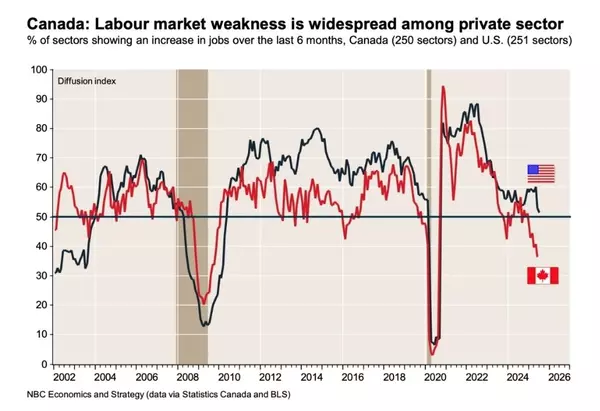
1. The US and the Canadian economy continue heading into different directions, even though it may not seem like it. US remains relatively strong, while Canada not so much. As Bank of Canada is still orchestrating a soft landing or tip-toeing around recession, the chances of Canada rate cut going first and hard is becoming more evident. The irony is, if Canada cuts rates and US doesn't, the Canadian dollar value will fall, and import costs from the US will rise, and inadvertently becomes inflationary again. Rate cuts or not, Canada will still get the shorter end of the stick.
2. Housing demand is up but remains relatively weak. Supply, too, is not that much exciting either. Buyers and Sellers are still trying to find grounds of their arguments. On one hand, Buyers complain there are not many good listings to choose from. For the Seller, if they don't get the price they want, they may choose to wait till the rate cuts in the hopes of better offer or price. The see-saw battle continues, and overall inventory will dictate the rhythm of the market.
3. As the noise of lower rates are getting louder, so are the misconceptions of mortgage rates. Keep in mind that mortgage rates are overall driven by bond rates, which remains highly volatile. For example, the benchmark Canada 5 year bond rate has seen a +0.7% change since beginning of 2024, all the while with the Bank of Canada overnight rate remaining unchanged at 5%. That means it was cheaper to get a fixed term mortgage at beginning of the year than it is now. Rate cuts are coming, but the noise may be overshadowed by bond rates and economic data.
4. Canadian government just announced that the 30-year insured mortgage amortization for first time home buyers, if they're buying a newly built home, effectively Aug 1, 2024. I do agree this policy's intentions are right and will benefit the younger buyers.
5. BC has one of the most expensive gasoline price in North America, and on April 1st, another hike in carbon tax definitely added fuel to the fire. Food prices and inflation will go up as the cost trickles down to the consumers. The government says they want the inflation to come down, but are imposing more taxes for inflation to jump up.
Here are the 3 highlights for March:
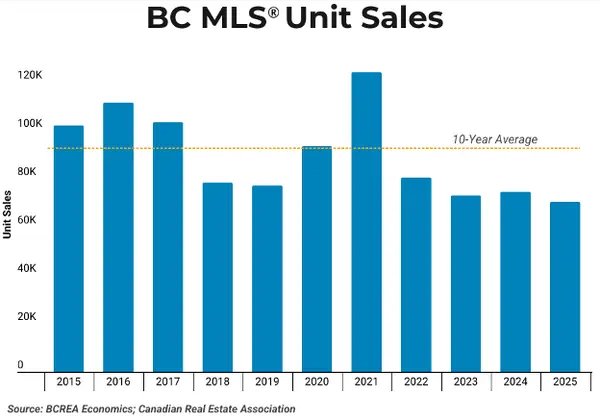
- Sales remain weak and is significantly below (-31.2%) the 10 year average, while total inventory has increased slightly (+6.3%). Inventory still remain low in historical terms.
- Overall market is shifting from a balanced market to a Seller's market as each segment and neighbourhood continue to have their own micro trends. Market is not uniformed like most Buyers and Seller has hoped for and is causing confusion.
- March continue another month of home prices gain of +1.1% (February price gain was +1.9%). There is indication that the market price jump is slower, and we may see price flat line in the next few months.
Here are the in-depth statistics of the March:
- Last month's sales were -31.2% below the 10 year February's sales average.
- Month by month residential home sales increased by +14.1% compared to February 2024, mainly due to Spring's seasonal market.
- Month by month new home listings increased by +9.4% compared to February 2024.
- Last month's price adjustment was +1.1% compared to February 2024.
- Sales-to-listing (or % of homes sold) ratio is 23.8% (compared to 22.4% in February 2024). By property type, the ratio is 18.2% for single houses, 31.3% for townhouses, and 25.8% for apartments/condos.
Download Vancouver Real Estate Market Report March 2024
Single House Market
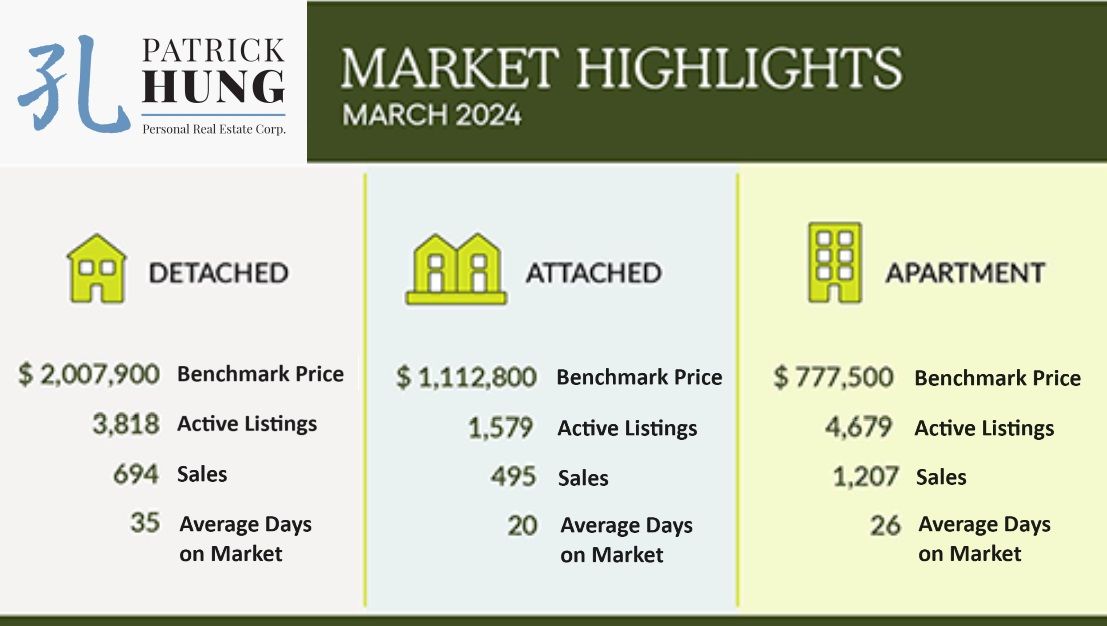
For the month of March, the areas with the most price gains are in Burnaby East, New Westminster and Sunshine Coast at +4.5%, +3.8% and +3.6% respectively. Conversely, the neighborhoods registered the most significant price drops are in Port Coquitlam, Squamish and Whistler with -1.5%, -0.3% and -0.1% respectively. The detached home market remains in a balanced market but is edging closer to a Seller market, with average days on market at 35 days (compared to 47 days last month), and month-to-month average price continue to climb by +1.8% (compared to +1.6%% last month). Sales-to-listing ratio (% of homes sold) has increased to 18.2%. (compared to 16% last month).
In March, the areas with the most townhouse price growths are Ladner, Tsawwassen, and Burnaby East, at a whooping +8.9%, +8.6% and +7.4% respectively. Conversely, the neighborhoods with the a least price growth are in Vancouver West, Squamish and Coquitlam, at -2.8%, 0%, and +0.1% respectively. The townhouse market has officially shifted to a Sellers market, with average days on market dropped significantly to 20 days (compared to 32 days last month). Month-to-month sale price continue to climb up by +1.7% (compared to +2.6% last month). Sale-to-listing (% homes sold) ratio is the best among all segments at 31.3% (compared to 27.9% last month).
Apartment and Condo Market
Of all the segments, apartments month-to-month sales have increased the least at +12% (compared to single house at +19% and townhouse at +25% respectively), and its monthly price gain was also the least at +0.9%. Even though apartments are still in a Seller's market, it really is a mixed bag and is heavily dependent on the product and area. For example, downtown apartment sales and prices still haven't recovered from the pandemic. Another example was that the recent completion at Concord Brentwood phase 2 has drawn a lot of attention, with it's high turnover rate and with the substantial loss of up to $200,000 for some Sellers. In short, Buyers who bought in Concord Brentwood phase 2 all had purchased at a high a few year ago at nearly $1300 per square feet. Now, they are forced to complete with higher interest rate, and are also stuck to sell at a loss with fierce competition. After the first two weeks of the Concord Brentwood project's completion, there were a whooping 64 listings that hit the market. At the weekend open house, there were more agents than buyers. This is a reminder that pre-sales are highly speculative as it's nature is a futures contract. This project will could be a sign that pre-sale investments are behind us, and those who are looking to profit from such investment-flips should be prepared for a rude awakening. On the end of the spectrum, older and more spacious condos (such as those over 1000 sf and under $700k) in Vancouver are still very popular, and are usually sold within two weeks. Overall, the apartment market is pulling in different directions, with investors getting burned on the new projects, and first-time home buyers pouncing on entry level products.
For the month of March, the best performing neighbourhoods for apartments are Burnaby East, New Westinster and North Vancouver, posting +3.1%, 2.8% and +2.6% gains respectively. Conversely, the areas with the most significant price drops were Sunshine Coast, Ladner, and Port Coquitlam with -1.5% & -1.2% (tied for 2nd and 3rd) respectively. The apartment and condo segment have shifted further into the Sellers market, with average days on market jumped up to 26 days (compared to 34 days last month). Month-to-month sale price has further improved at +0.9% (compared to +2.5% last month). Sale-to-listing (% homes sold) ratio remained remained flat at 25.8% (compared to 25.9% last month).
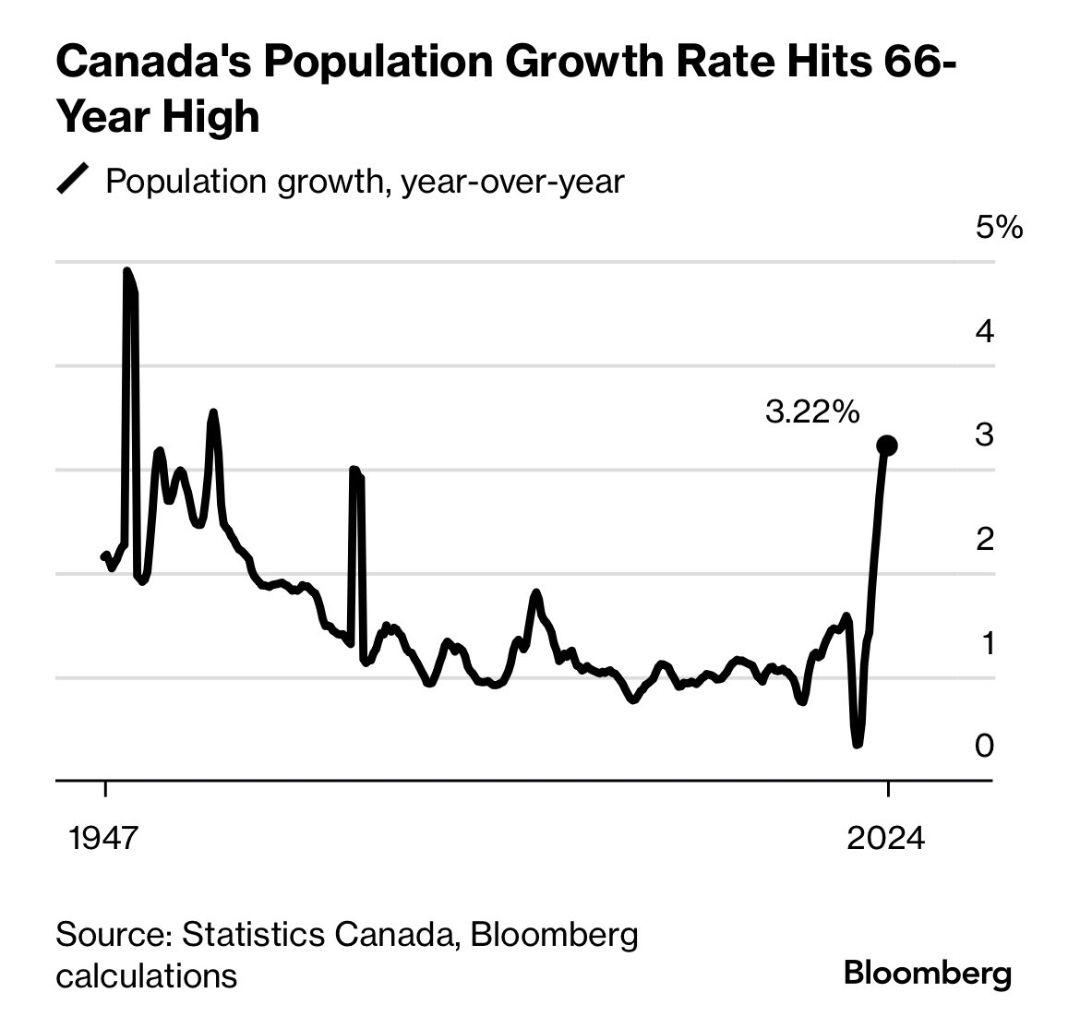
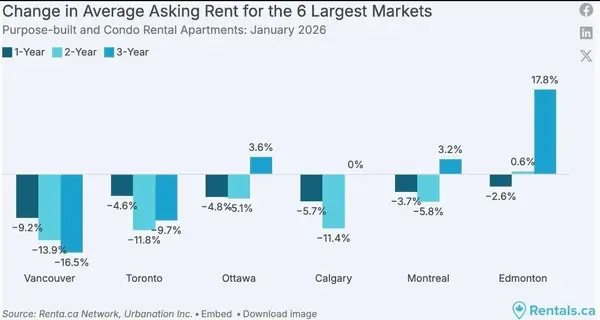
Canada's allowed nearly 1.2 million immigrants into Canada in 2023, which was a 66 year high. It was no surprise that the surge in population has caused all sorts of social unrest, from housing shortage to infrastructure nightmare such as overloaded hospitals and schools. Policies like these are similar to inviting guests over for dinner without enough food. Thus, the Canadian immigration minister, Marc Miller, has recently stated that he will be shrinking non-permanent residents by 2027. This will surely have a stabilizing affect on the rental price. (Source: Bloomberg)
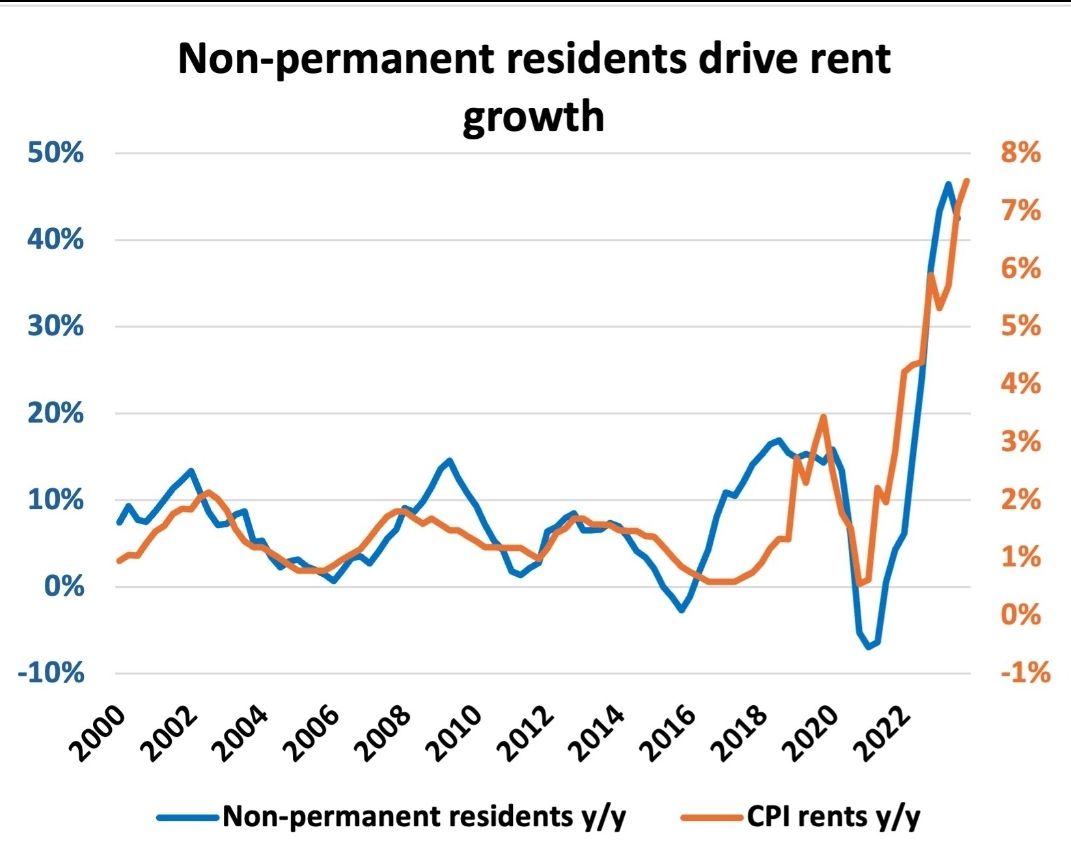
2. Hand in Hand
Speaking of rent growth, we can clearly see that rent prices go hand in hand with the increase in permanent residents. Once the dust settles, I expect rent growth to return to normalized return on investment of around 3% per year going forward. (Source: BCREA Economics)
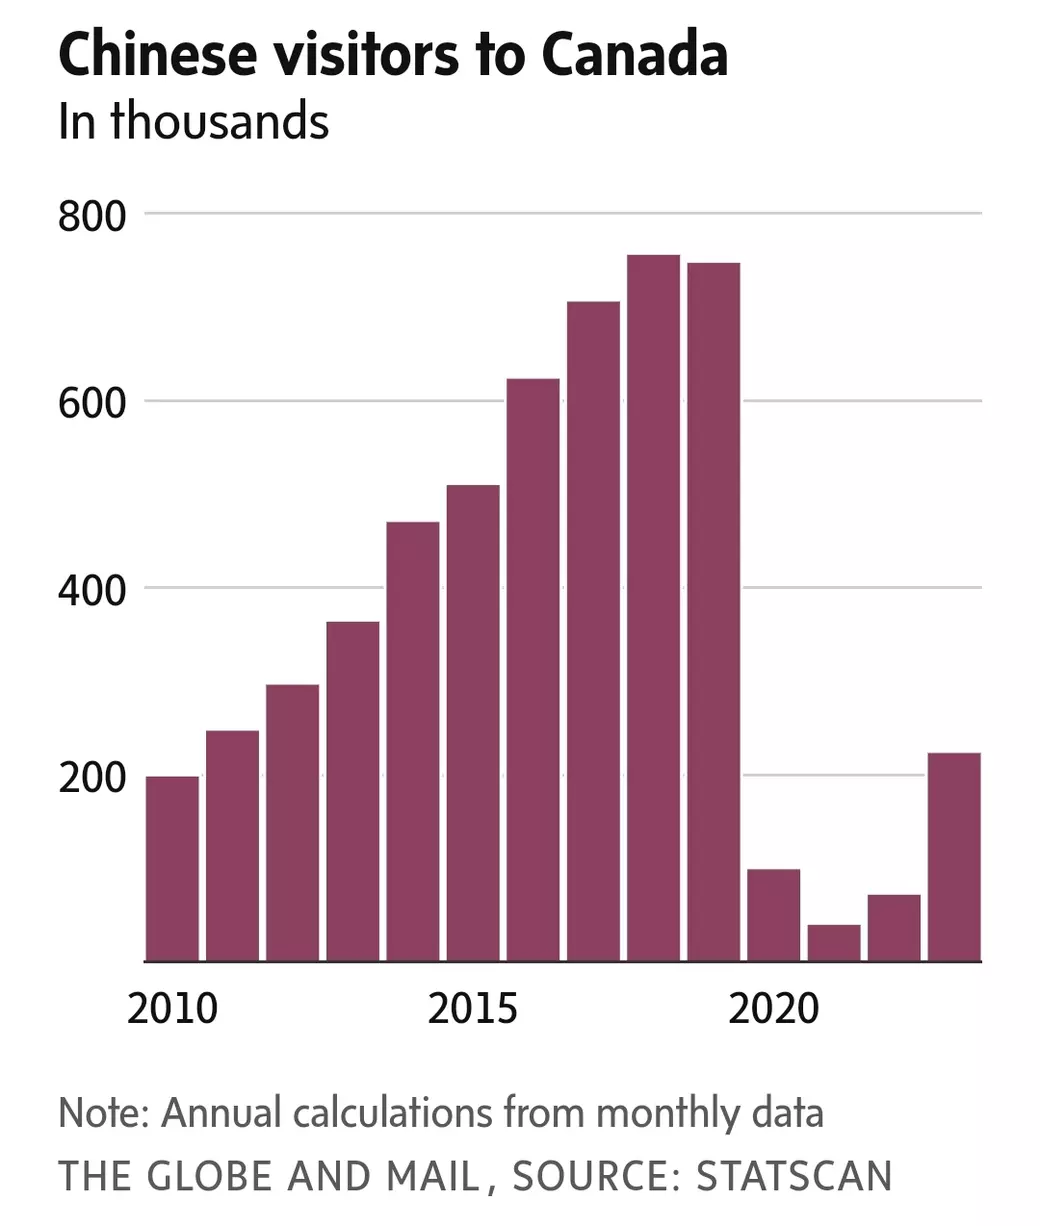
3. Tourism Woes
China has been a long tourism cash cow for Canada, and at one point reached over 700,000 visitors in 2018. However, those days are long gone. As Canada and China's diplomatic tension continues, and with China's economy under-performing, the Chinese visitors may continue to trend low, even after a full year of borders being re-opened after the pandemic. Canadian tourism is finding ways to replace the missing Chinese cash cow. (Source: StatsCan)

Recent Posts


GET MORE INFORMATION