

Real Estate Market Intelligence June 2023
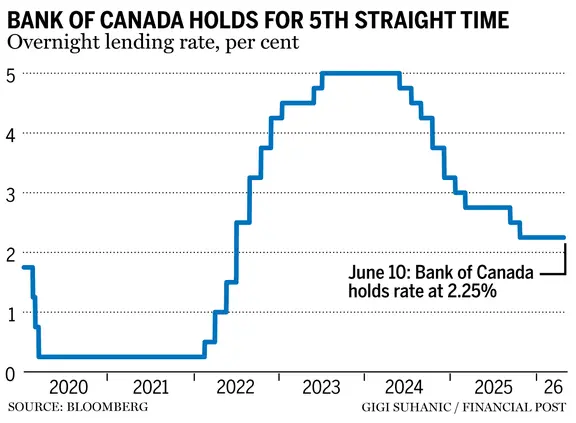
Summer is here, and with the Spring frenzy real estate market in rear view, we are entering into phase two of the rapid evolving market. In the month of May, the unique polarizing trend is that the sales are edging back up to 10 year average, while inventory remains near 20 year low. Although we are seeing more new supply in May, the demand continues to be strong. By the same token, home prices have increased for the 6 consecutive month. I was often asked if this upward price trend can keep up. This may sound overly simple, but the theme so far this year has been on the housing supply, which is really a telling story of how the Vancouver real estate market is being dictated now. High interest rate are not only making the unhappy Buyers, but the Sellers are equally upset. Where are the Sellers going if they can't buy? The demand, on the other hand, is surprising as buyers continue to defy odds of higher interest rate and jumping into the market. However, we do see signs of the frenzy slowdown last month, and multiple offers are starting to cool. Listings that used to attract 10 offers in early Spring, now may end up with 3 or less. Single house and apartment markets are starting to see signs of price exhaustion, while townhouse (the missing middle) remains hot. As wild as the recent market has been, the Bank of Canada's recent 0.25% rate hike has taken many by surprise, myself included. Even though this is a small hike, it may be a hint of what's in store in the summer months and in the next July announcement. April's surprising inflation data jump by +0.7% to 4.4%, which is mainly contributed by the rising gas cost that has also increased by 6.3%. Another recent surge in June for gas prices will sure add more fuel to the fire, and will likely cause the Bank of Canada to continue the upward rate hike path in July. I personally believe there is at least another round of rate hike before September. Given the current environment, we are starting to see Canadian businesses hunkering down. Cracks are starting to show: business profits are thinning quickly and hiring are slowing. More noticeably, real estate developers are slowing construction as their profit continue to diminish. Ironically, this will hurt the supply further in 3-5 years, and inadvertently creating further upward price pressure. As we enter the typically slow summer real estate season, I would expect less sales and inventory. Buyers will continue to have even fewer choices in the summer. Bank of Canada's next rate announcement is July 12 will be a crucial one. Let's see.
Some of the unique trends I've been observing:
1. Bank of Canada's rate hike of 0.25% will not immediately be affecting the real estate market. As we know that rates are lagging indicators, it will take at least 2-3 months of this to materialize. Buyers who are pre-approved will still get in.
2. Greater Vancouver rental prices will continues to soar. Those would-be-Buyers who got priced out will stay as renters. Slower construction compounded with this year's projected 1.9 million immigrants, and we are staring in the eye of a perfect rental storm.
3. Rising costs continue to hurt developers, with profits thinning out quickly for projects. Building permits are dropping, and trades are starting to ask for work. Expect jobs and income losses from the development sector soon.
4. Employment market are seeing signs of slowdown in hiring. Businesses are more cautious than ever in their spending.
5. Multiple offers scenarios beginning to slow, and price acceleration should slow further in the summer months.
Here are the 3 highlights for May:
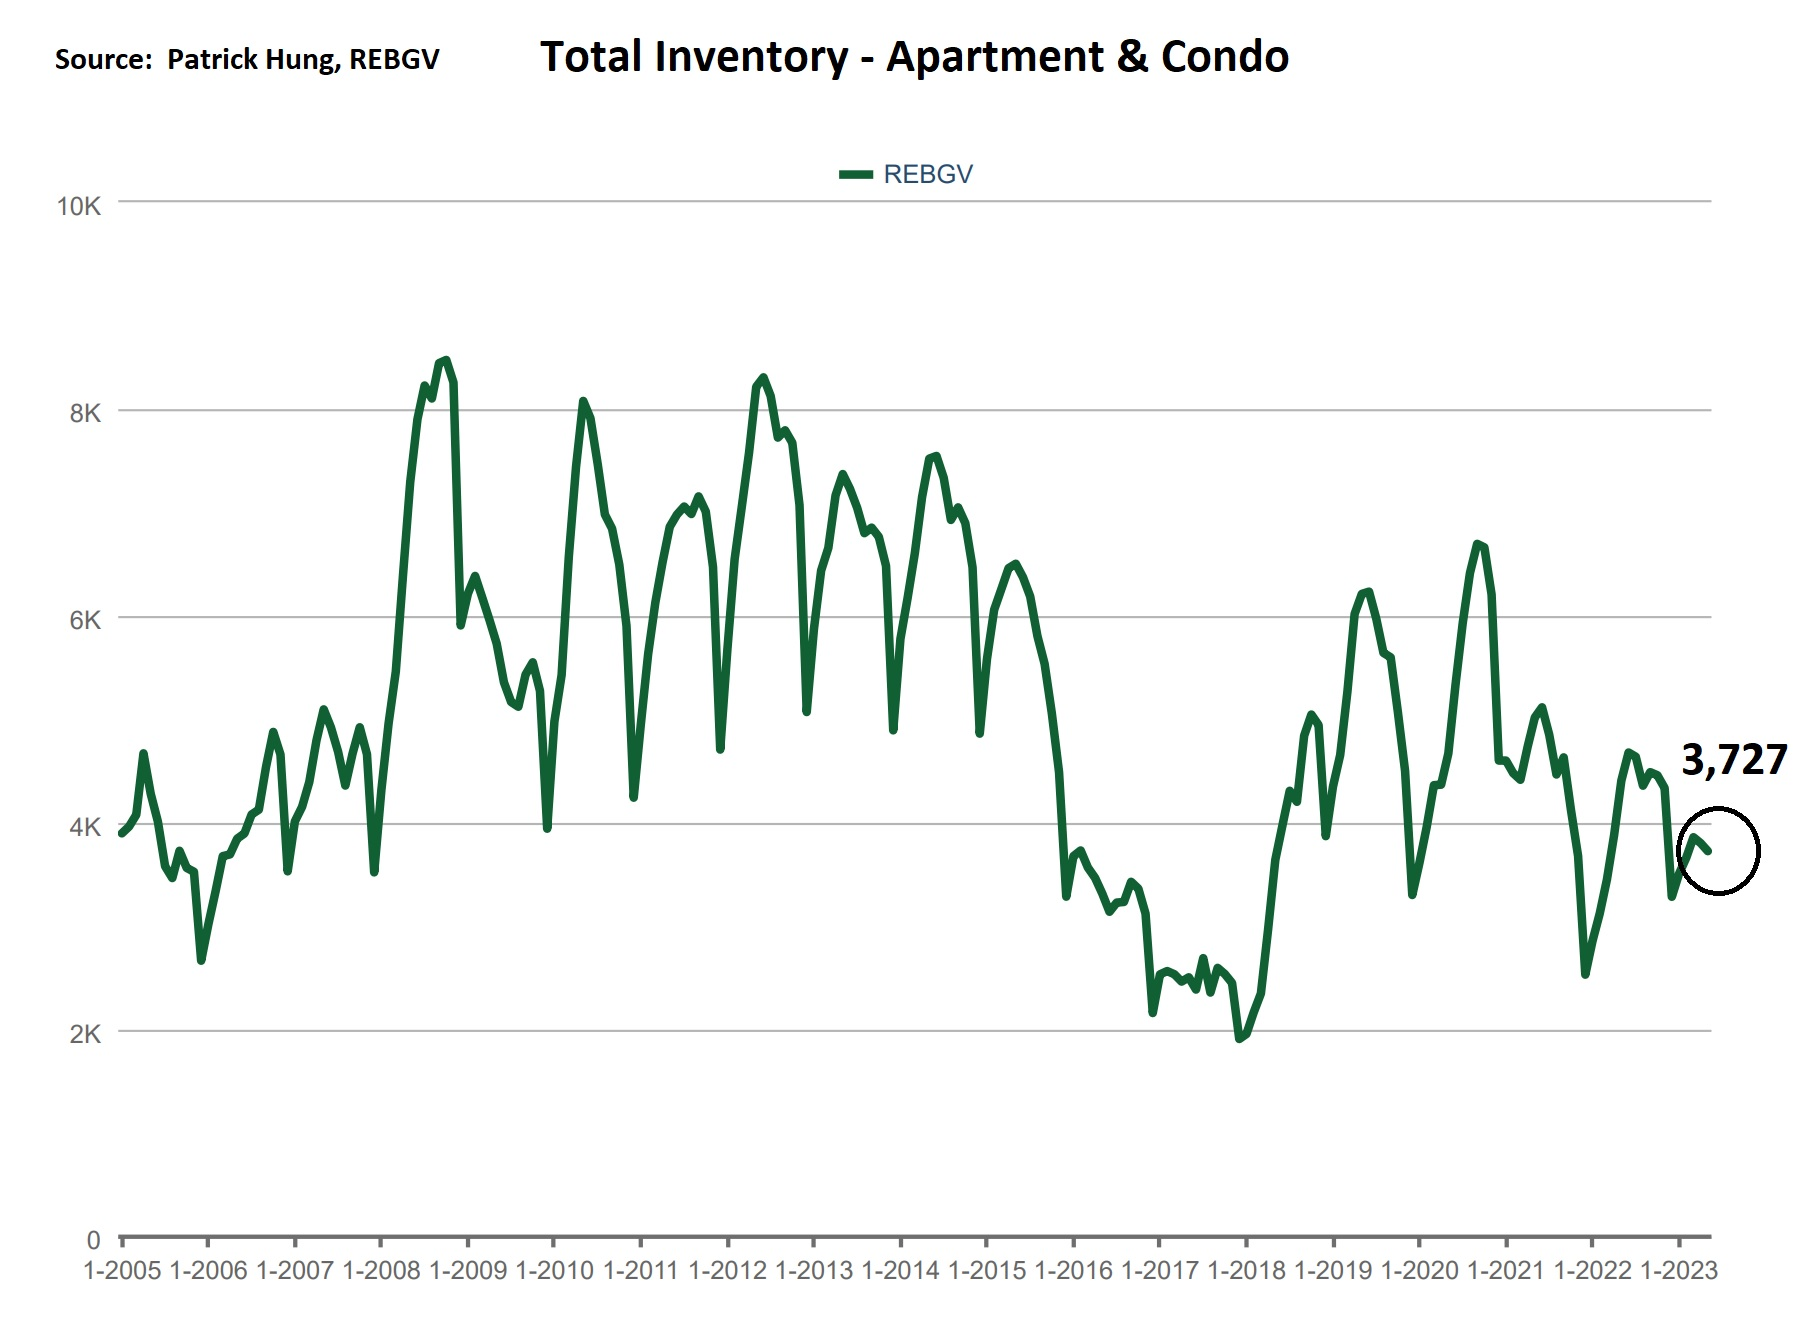
- Sales are returning to near 10 year average, while total inventory remain near 20 year low.
- New listings have shot up drastically in May, but still not enough to meet demand.
- Monthly price surge has calmed, with May's monthly increased by +1.3%. (April's was +2.4%)
Here are the in-depth statistics of the May:
- Last month's sales were -1.4% below the 10 year May's sales average.
- Month by month residential home sales increased by a whooping +24.6% compared to April 2023.
- Month by month home listings increased by +30.8% compared to April 2023.
- Last month's price adjustment was +1.3% compared to April 2023.
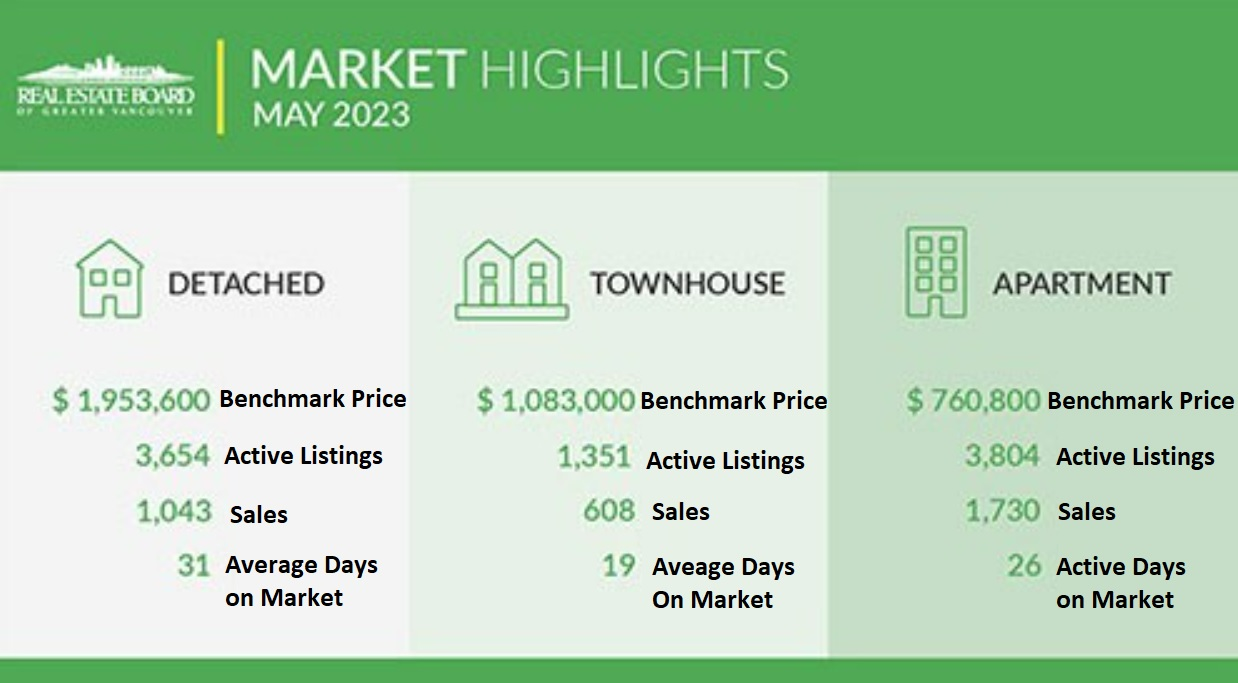
- Sales-to-listing (or % of homes sold) ratio is 38.4%. By property type, the ratio is 28.5% for single houses, 45% for townhouses, and 45.5% for apartments/condos.
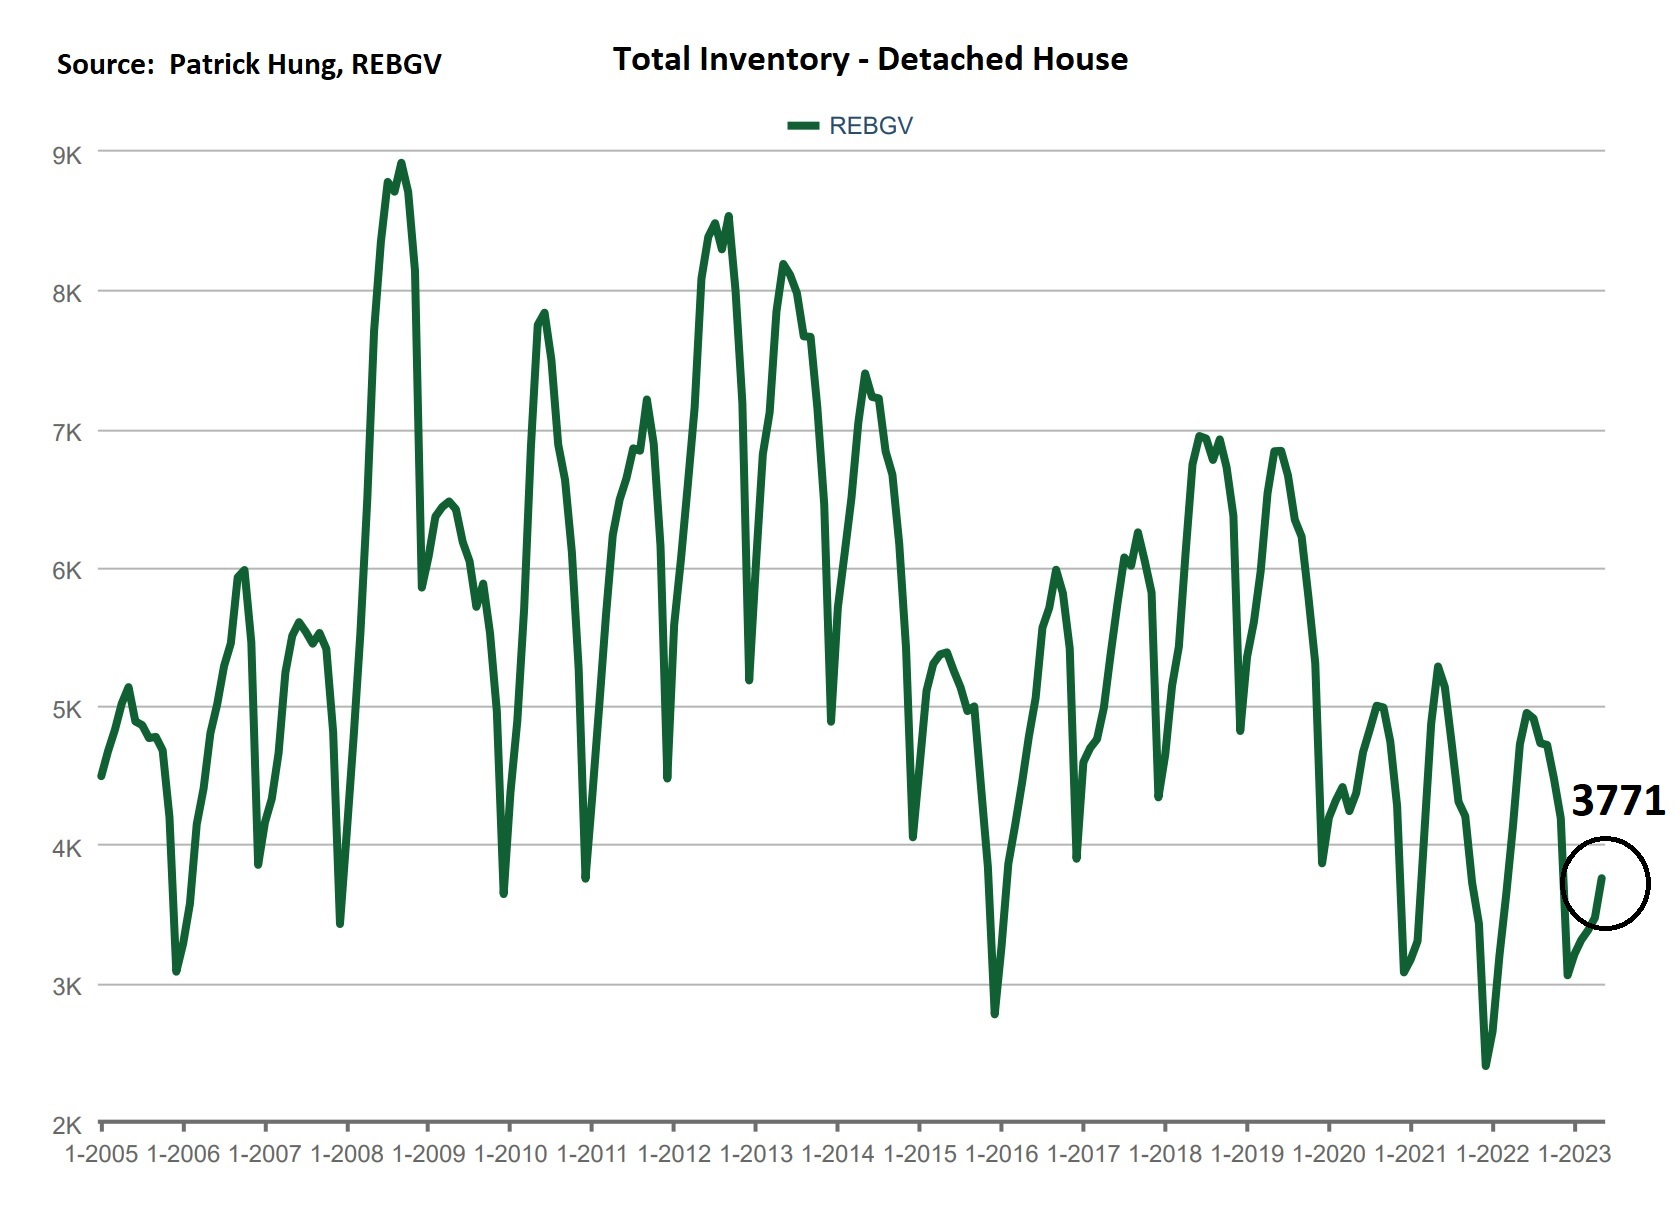
The dream of owning a single house continues to be in full swing for Buyers in May. Similar to the month before, the single house market price continues to rip higher with the monthly gain of +1.8% last month (compared to +2.9% in April). Supply also increased by +7.8% and is the only segment for such a significant increase, compared to townhouse (flat in supply) and apartment (drop in supply). We are in a unique environment where single house supply and price are both increasing, and this may be a sign of prices starting to level. Multiple offers are still happening on a weekly basis, but with less participation rate. Greater Vancouver single houses under priced under $1.75m are in extremely high demand, with stunning sales ratio in these hot spots: Vancouver Eastside (70%), North Vancouver (100%), West Vancouver (100%), Richmond (92%), Tsawwassen (50%), Ladner (83%), Burnaby (82%), New Westminster (60%), and Coquitlam (86%). On the other side, Fraser Valley single houses under $1.5m is also very popular, especially in Cloverdale, where homes in such price range has 100% sales ratio. At the current rate, inventory clearly cannot meet demand, and it needs months and months of oversupply to even bring the single house market back to normal. Before then, we should see prices continue to climb, albeit at a slower pace in the upcoming months. For the month of May, the areas with the most price gains are Pitt Meadows, New Westminster and Burnaby East, at +6.5%, +4.8% and +4.7% respectively. Conversely, the neighborhoods with the price drops are Bowen Island, Sunshine Coast, Port Moody, with -4.9%, -2.9% and +0.5% respectively. The detached home market continue to move further into the Seller's market, with average days on market remaining dropping slightly to 31 days (compared to 33 days last month), and month-to-month average price are up +1.8% (compared to +2.9% last month). Sales-to-listing ratio (% of homes sold) has increased slightly to 28.5% (compared to 24.4% last month).
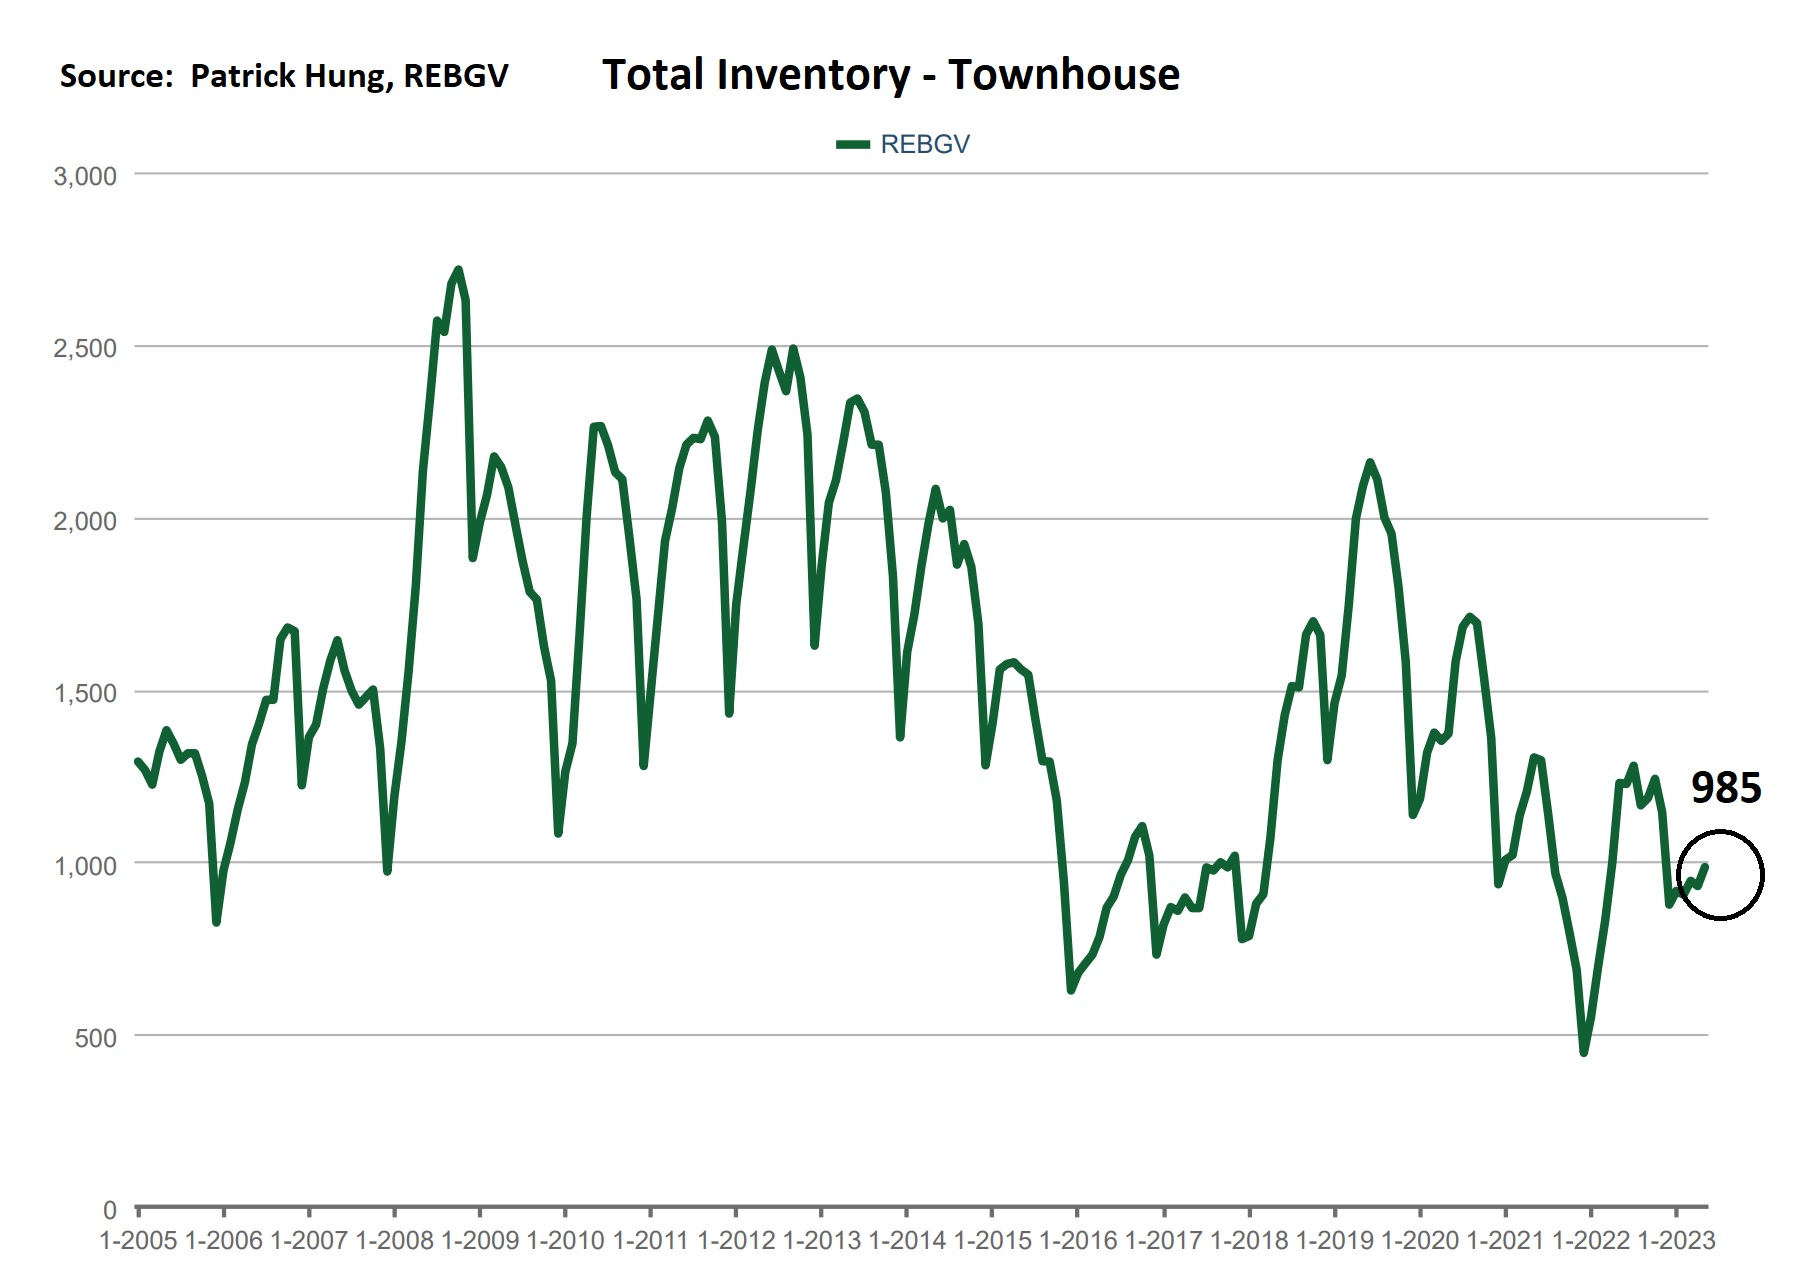
Townhouses market aka "The Missing Middle" continues to be in high demand in May. What is interesting is that there is a substantial increase in new listings (a whooping +25.7%), while at the same time this is met with increased sale (+20.2%). Any new townhouse listings that are reasonably priced will be snatched up by Buyers in less than 2 weeks, especially those that are priced under $1.2m in Greater Vancouver. Thus, total inventory has only increased marginally, despite the surge in new supply. Another intriguing trend beginning this year is that Vancouver newly constructed townhouse prices under $1.8m are selling out like hotcakes, and the prices of these new townhouses are starting to creep near and over $2m. I have been asked: "Why would anyone want to buy a $2m townhouse?" Answer is simple: central location, brand new with air conditioning. This has to do with Buyers' lifestyle and behaviour change, where they don't need a big backyard nor to mow the lawn anymore. Rather, they would enjoy the air conditioned home with new kitchen cabinets that are 10 min drive to the city core. Newer, smaller, "cooler" will be the norm going forward. Last month's townhouses' sales to listing ratio (% of homes sold) is 45%, the highest month so far this year. Prices only increased only slightly at +0.2%. Much like single houses, multiple offers in townhouses are still happening on a regular basis, and that is mainly in the Greater Vancouver area. Ironically, we are still see price polarity among neighbourhoods. In May, the areas with the most townhouse price growths are in Burnaby East, Maple Ridge and Port Coquitlam, with gains of +3.4%, +2.4%, and +2.2% respectively. Conversely, the neighborhoods with the most significant price drops are Vancouver West, Squamish and Sunshine Coast, at -3%, -2.1% and -1.6% respectively. The townhouse market is pushing further into the Sellers market, with average days on market dropping to 19 days (compared to 25 days last month). Month-to-month sale price has increased only slightly by +0.2% (compared to +2.1% increase last month). Sale-to-listing (% homes sold) ratio continues to climb to 45% (compared to 40.1% last month).
The apartment market in May has been the most unique segment of all property types. On one hand, we have increased sales (+18.4%) and increased new listings (+19.4%). This is good news as new supply is met with equally strong demand. However, we see a slight drop of total inventory (-2.4%), which is surprising given that apartments are the most common property type in the province. Upon close ovservation, we know that the apartment segment, which mainly consist of first time home buyers and investors, are much more resilient than expected. The popularizing trend is a sharp drop of the average apartment investors, as the numbers don't make sense anymore. Conversely, first time home buyers are defying all odds and jumping in, possibly with the help of daddy-and-mommy bank. When we dig deeper, the numbers paint a scary picture. Everywhere we look, apartments under $600k are in such high demand it's completely tipping the market, with sales ratio (% of homes sold) in these hot spots under $600k: Vancouver Westside (100%), Vancouver Eastside (43%), North Vancouver (100%), Richmond (98%), Ladner (100%), Burnaby (79%), New Westminster (96%), Coqutlam (73%), Port Coquitlam (100%), and Port Moody (58%). There really is nowhere to hide, and soon we will see that $600k entry point get pushed to $700k. The only question is, when. For the month of May, the best performing neighborhoods for apartments are West Vancouver, Vancouver East and Burnaby North, posting +3.2%, +1.9% and +1.5% gains respectively. Conversely, the areas with the most significant price drops were again all in the outskirts of Sunshine Coast, Whistler and Squamish, with -2.6%, -0.4%, and -0.4% respectively. The apartment and condo market shifts further into to a Seller's market, with average days on market dropping to 26 days (compared to 25 days last month). Month-to-month sale price is +1.1% (compared to +2.0% last month). Sale-to-listing (% homes sold) ratio continues to climb to 45.5% (compared to 37.4% last month).
Here are the Three Trends I'm Observing:
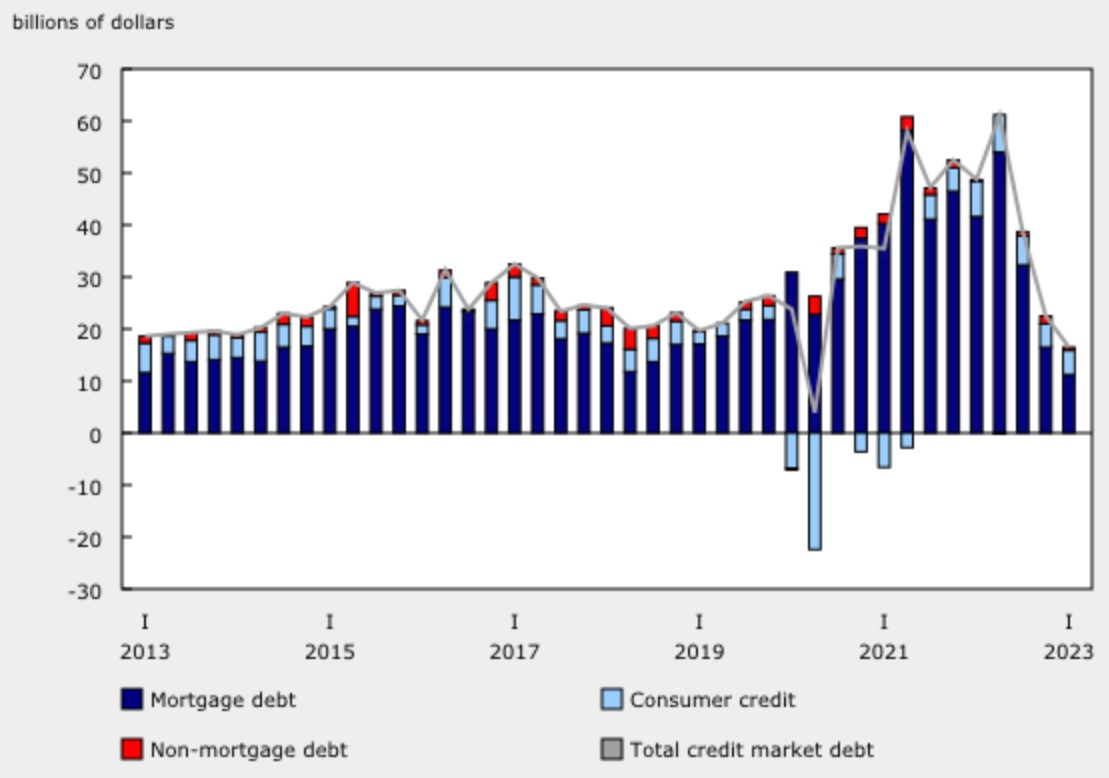
1. Downward Growth
Canadian mortgage growth is $11.2B in Q1 of 2023, which is the weakest in the past 20 years. High interest rate is starting to take hold a year after the initial hike. Bank of Canada's recent move to of another rate hike (and possibly more in the summer) means mortgage growth will slip further. (Source: Statistic Canada)
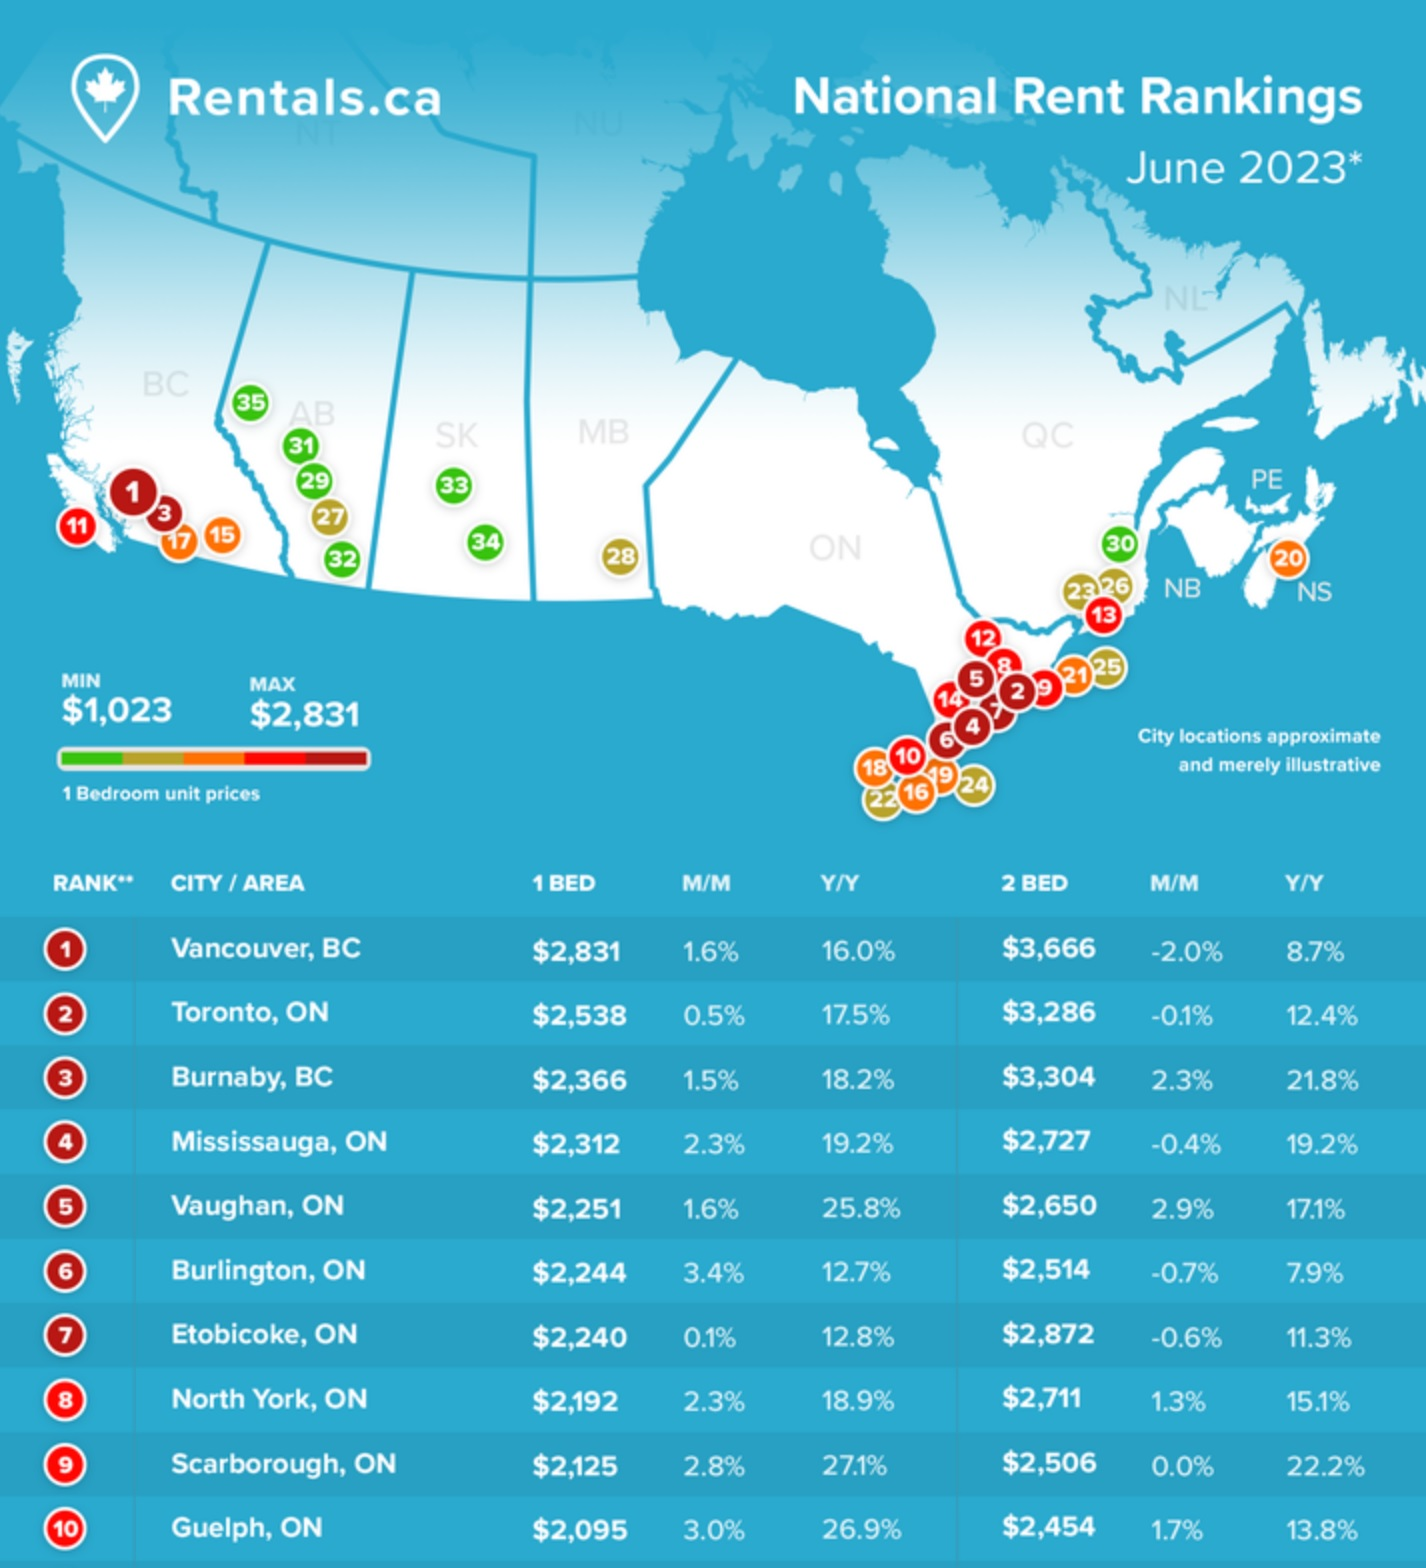
2. Crown
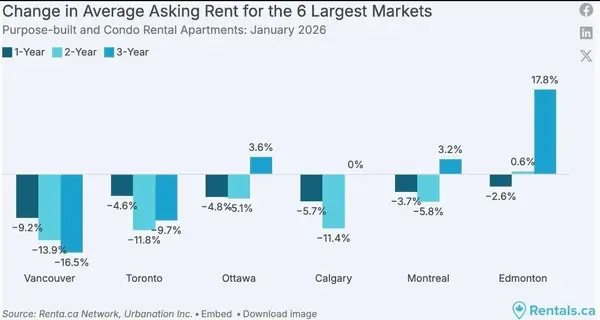
Once again, Vancouver takes the crown with the highest rental rate in Canada ($2,831 for 1 bedroom), with year-over-year rent growth of 16%. With nearly 1 million immigrants coming in last year, and another projected 1.9 million more this year, the only direction the rent will go is up. (Source: Rentals.ca)
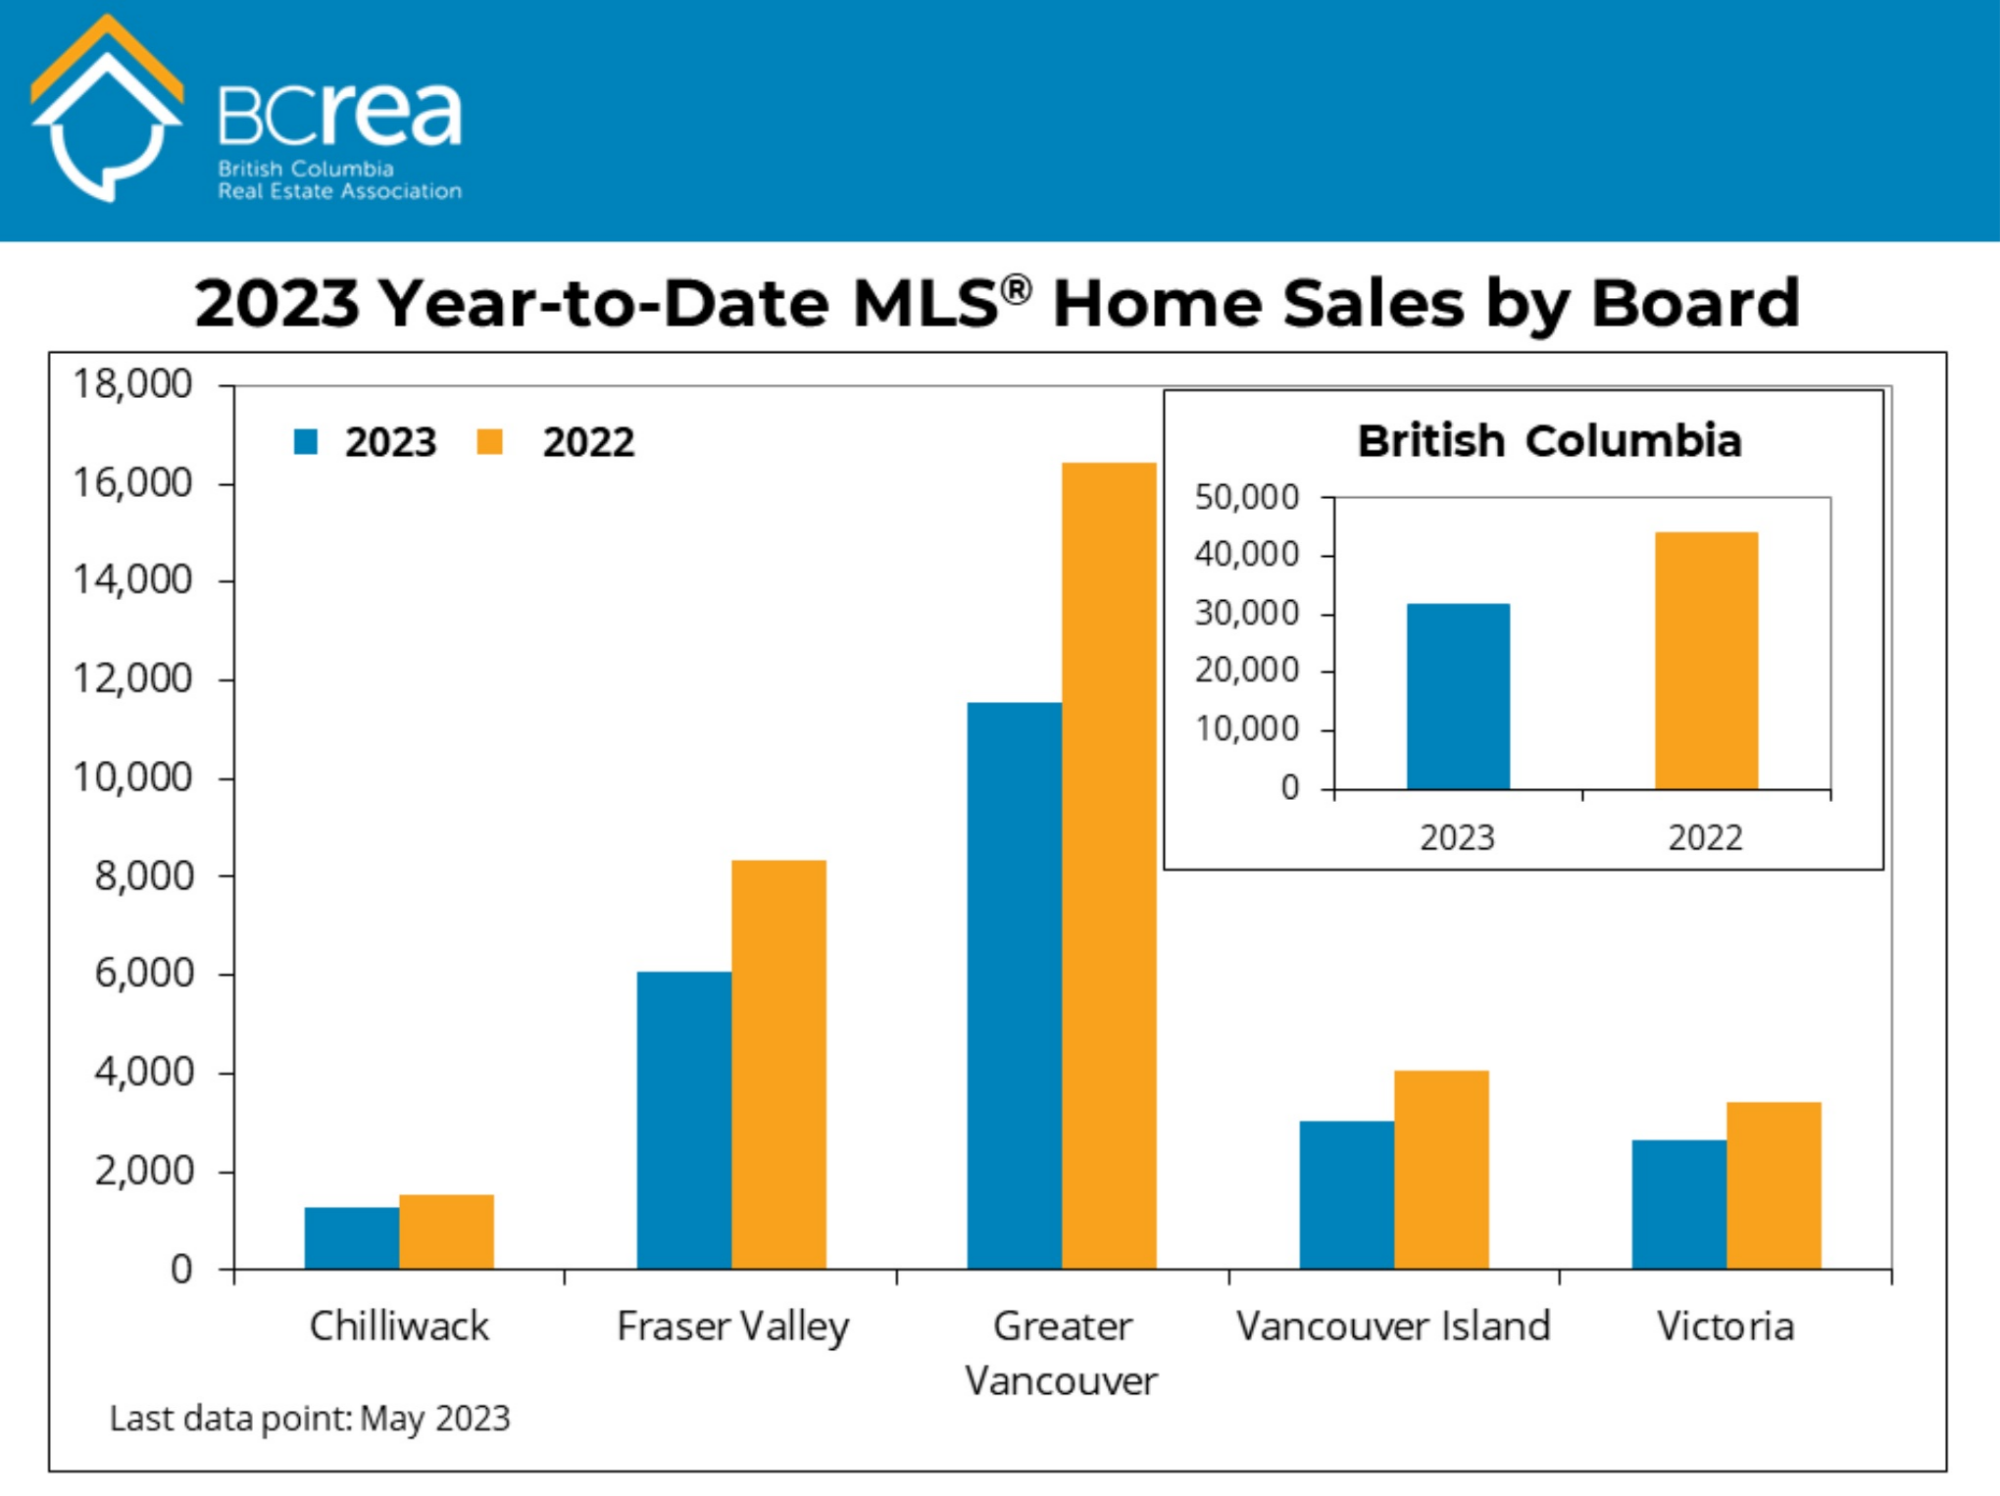
3. Sellers' Retreat
Year to date real estate sales have slumped -27% compared to last year, as Sellers continue to retreat. The short supply trend will likely continue in the near future, especially when we head into the typically slower summer months. (Source: BCREA).
Recent Posts

GET MORE INFORMATION