

Real Estate Market Intelligence May 2023
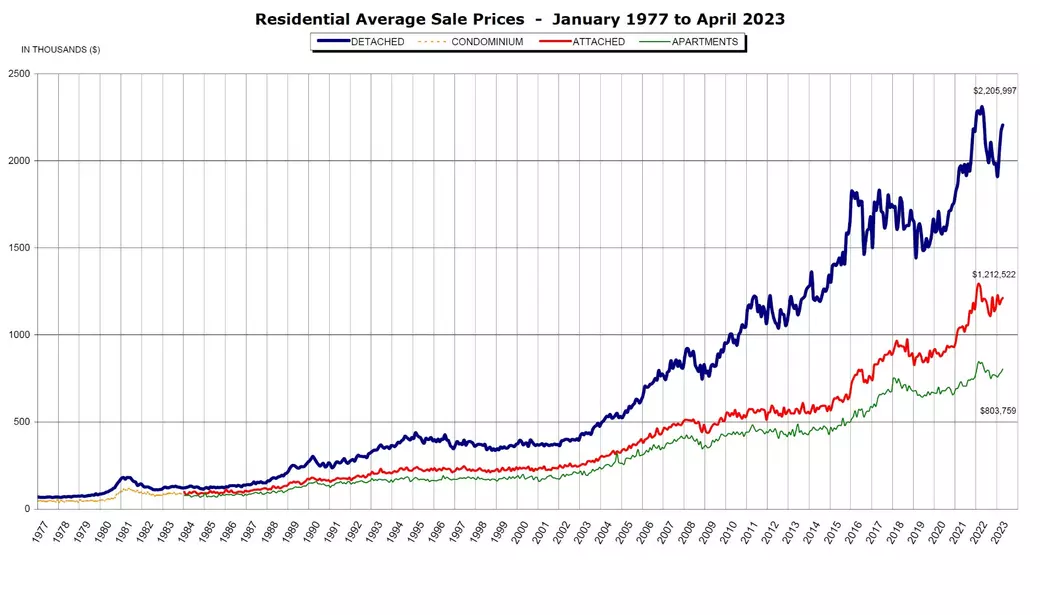
Just How Hot Is the Current Market?
Spring in is full swing, summer is around the corner, weather is getting warmer, and the Greater Vancouver real estate market just keeps getting hotter. April has proven to be one of the busiest months of the year, as if the alarm has gone off and woke up the Buyers all at once as they rush towards their home purchasing goals. At any given open house of a new listing that is reasonably priced, they are packed with Buyers. Perhaps I sound like a broken record, but the consistent trend this year has been the lack of new supply. What is the most intriguing is that April's supply is LESS than March (typically supply increases in April over March). There were only two instances when such happened, first in 2009 during the global financial crisis, and the second time is 202 when Covid caused lockdowns. What is different this time around is that we are neither in those crisis, but a recession is looming. In the times of uncertainty, Sellers of real estate usually hold off, and thus creating the current supply crunch and is causing further upward price pressure. Note that this is not area specific to Vancouver, or Toronto, or Canada, but in the US as well. Despite the elevated borrowing costs, last month's Greater Vancouver home prices jumped up another +2.4%, with BC's year-to-date price gain of nearly +9.8%%! Like the old supply-demand saying: prices go up while supply goes down. In fact, April's new inventory is lowest for the month since 2005, and total supply is 20.9% below the 10 year average. Needless to say, all segments are now in the Sellers' market, and will continue to be so in the near future. Unless something happened drastically, I don't see how inventory will suddenly increase anytime soon. As we know, supply takes a long time to accumulate. Thus, it will take months of oversupply (or demand suddenly falling off a cliff) to at least bring the market back to a balanced level. On the housing demand and Canadian immigration side, the first two month of 2023 saw a huge surge on immigration, with a whooping 100,000 new permanent residents and 200,000 non-permanent residence (students and work permit). If these number persist for the remaining of the year, we will be seeing 1.8 million new Canadian residents, which will be the highest on record. Imagine what the demand would like in 2-3 years, when these immigrants settle and look for a place to purchase? On the supply side, Canadian new housing builds and permits this year is hitting another low, with 261k (2022) vs. 211k (2023). If these number tell us anything, we will have 1.8m new immigrants and less supply than last year. This imbalance should sound the alarm for Canadian government on all levels. Moreover, elevated construction costs such as labour, material, taxes, and high borrowing costs are corroding the developer's profits: there is barely or no money to be made on building. As for our neighbours down south, the latest US Fed's rate announcement of +0.25% will most likely spell the end of their rate-hike cycle. With that in mind, the Bank of Canada should be convinced of maintaining their current rate hold policy and is in line with our neighbours, which in return will not be wrecking havoc on the Canadian economy (i.e devaluation of Canadian dollar). This should further help keep inflation down and steady the ship, at least this year. Time and again, the Greater Vancouver real estate market has always been resilient and never ceases to surprise. Flowers are blooming, and spring is only halfway through. Let's see how much hotter this market will get.
Some of the unique trends I've been observing:
1. Canadian immigrant is poised to set another record, with the first two months of 2023 welcoming 100k new permanent residents, and 200k non-permanent residents. From rental to resale to presale, this will put a tremendous amount of stress on housing.
2. Canadian New Housing built is down from 261k (2022) vs 211k (2023). Vancouver sees an increase in multiple-family builds, but a sharp drop in single house builds. As this trend look to continue in the foreseeable future, expect single house prices to be the most desirable and bullet-proof property type.
3. Taxes have become an obstacle for newly built homes. A study has shown that, for a $1m Toronto new construction, 30% or $300k of it is in tax. Vancouver is not that far behind. Where is the incentive for the developers to build when there is hardly any profit? Oh, and CMHC (Canadian Mortgage and Housing Corp) has just increased their rental construction fee by 100-200%. On one hand, they tell us we are in a housing supply crisis. On the other hand, they raise the taxes on new builds.
4. Multiple offers scenarios continue in April and into May, although at a less frantic pace. What an under-priced single house used to attract 50 offers in March, it is now attracting 30 offers. FOMO (Fear of Missing Out) is real in the market. The price has climb so fast in such a short period of time (Jan to April) that price exhaustion is starting to show.
5. BC's unemployment rate in April rose to 5% (compared to 4.5% in March). Noteworthy is that the increase in part-time hires has offset the layoffs on the full-time layoffs. Also, minimum wage in BC will increase by a dollar to $16.25, effective June 1, 2023, to reflect the 6.9% annual inflation rate in 2022.
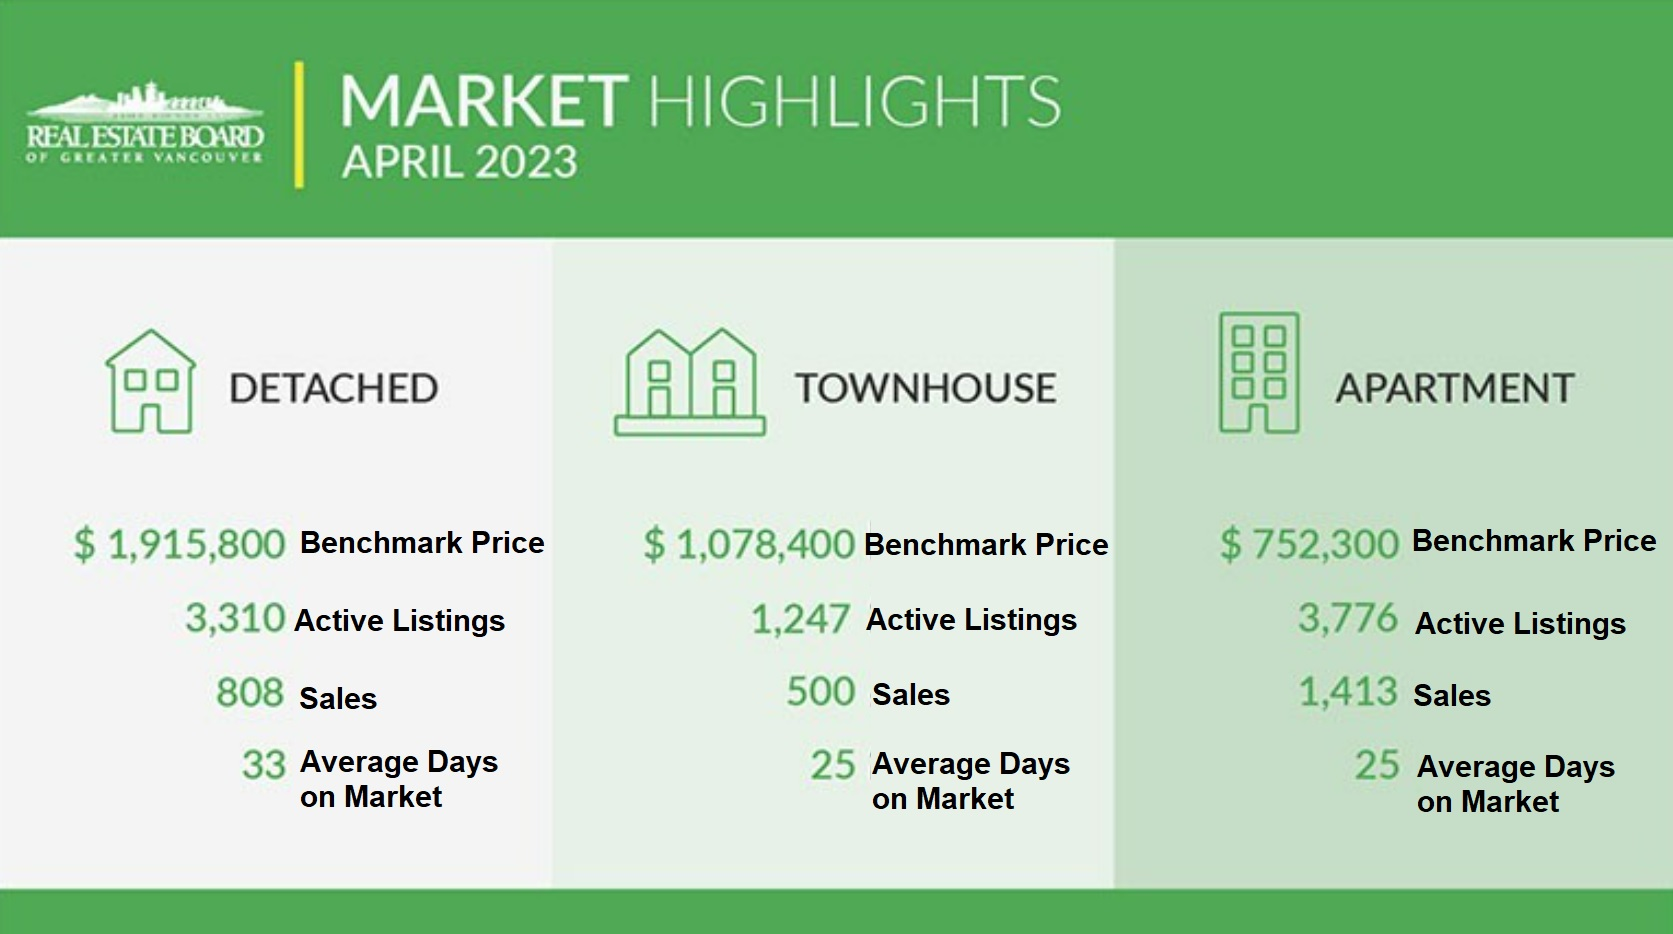
Here are the 3 highlights for April:
- One of the lowest number of total listings on record in April since 2005.
- All segments are now in the Seller's market.
- Monthly price surges higher, with April's monthly increase by +2.4%. (March's was +1.8%)
Here are the in-depth statistics of the April:
- Last month's sales were -15.6% below the 10 year April sales average
- Month by month residential home sales increased by +8% compared to April 2023.
- Month by month home listings decreased by -0.5% compared to April 2023.
- Last month's price adjustment was +2.4% compared to April 2023.
- Sales-to-listing (or % of homes sold) ratio is 32.7%. By property type, the ratio is 24.4% for single houses, 40.1% for townhouses, and 37.4% for apartments/condos. 
The detached house market continues to rip higher with the biggest monthly gain of +2.9% last month. This is the most significant monthly price jump in the past 11 months. Ironically, this is the only segment for the supply to increase, compared to apartment supply going down while townhouse supply remaining flat. Why is the price going up while the supply is also going up? Well, the quick price acceleration is starting to slow down the market, with some would-be single house buyers being priced out, or rather going with a different option, such as a bigger townhouse. Multiple offers are still very active on a weekly basis, albeit dialed down a bit in April compared to March. As we witness such fast price acceleration, we are also seeing price exhaustion. Single house prices may flat line in the summer/fall, although it still highly depends on the inventory. Neigbhorhoods such as North Vancouver, Burnaby, North Delta and Port Moody are very active, with sales to listing ratio (% of homes sold) well over 40% and driving them further into the Seller's market. Most entry level homes under $1.8m in the Greater Vancouver area and under $1.5m in the Fraser Valley (Surrey, Delta) are sold in less than 2 weeks to multiple offers. Price gains will continue in the near future as supply will typically fall in the summer months. For the month of April, the areas with the most price gains are Bowen Island, Tsawwassen and Ladner, at +8.3, +7.2% and +7.1% respectively. Conversely, the neighborhoods with the least significant price gains are Port Moody, New Westminster and Coquitlam, with -1.8%, +0.2% and +0.7% respectively. The detached home market continue to move further into the Seller's market, with average days on market remaining dropping to 33 days (compared to 39 days last month), and month-to-month average price are up +2.9% (compared to +2.7% last month). Sales-to-listing ratio (% of homes sold) has increased slightly to 24.4% (compared to 23.3% last month). 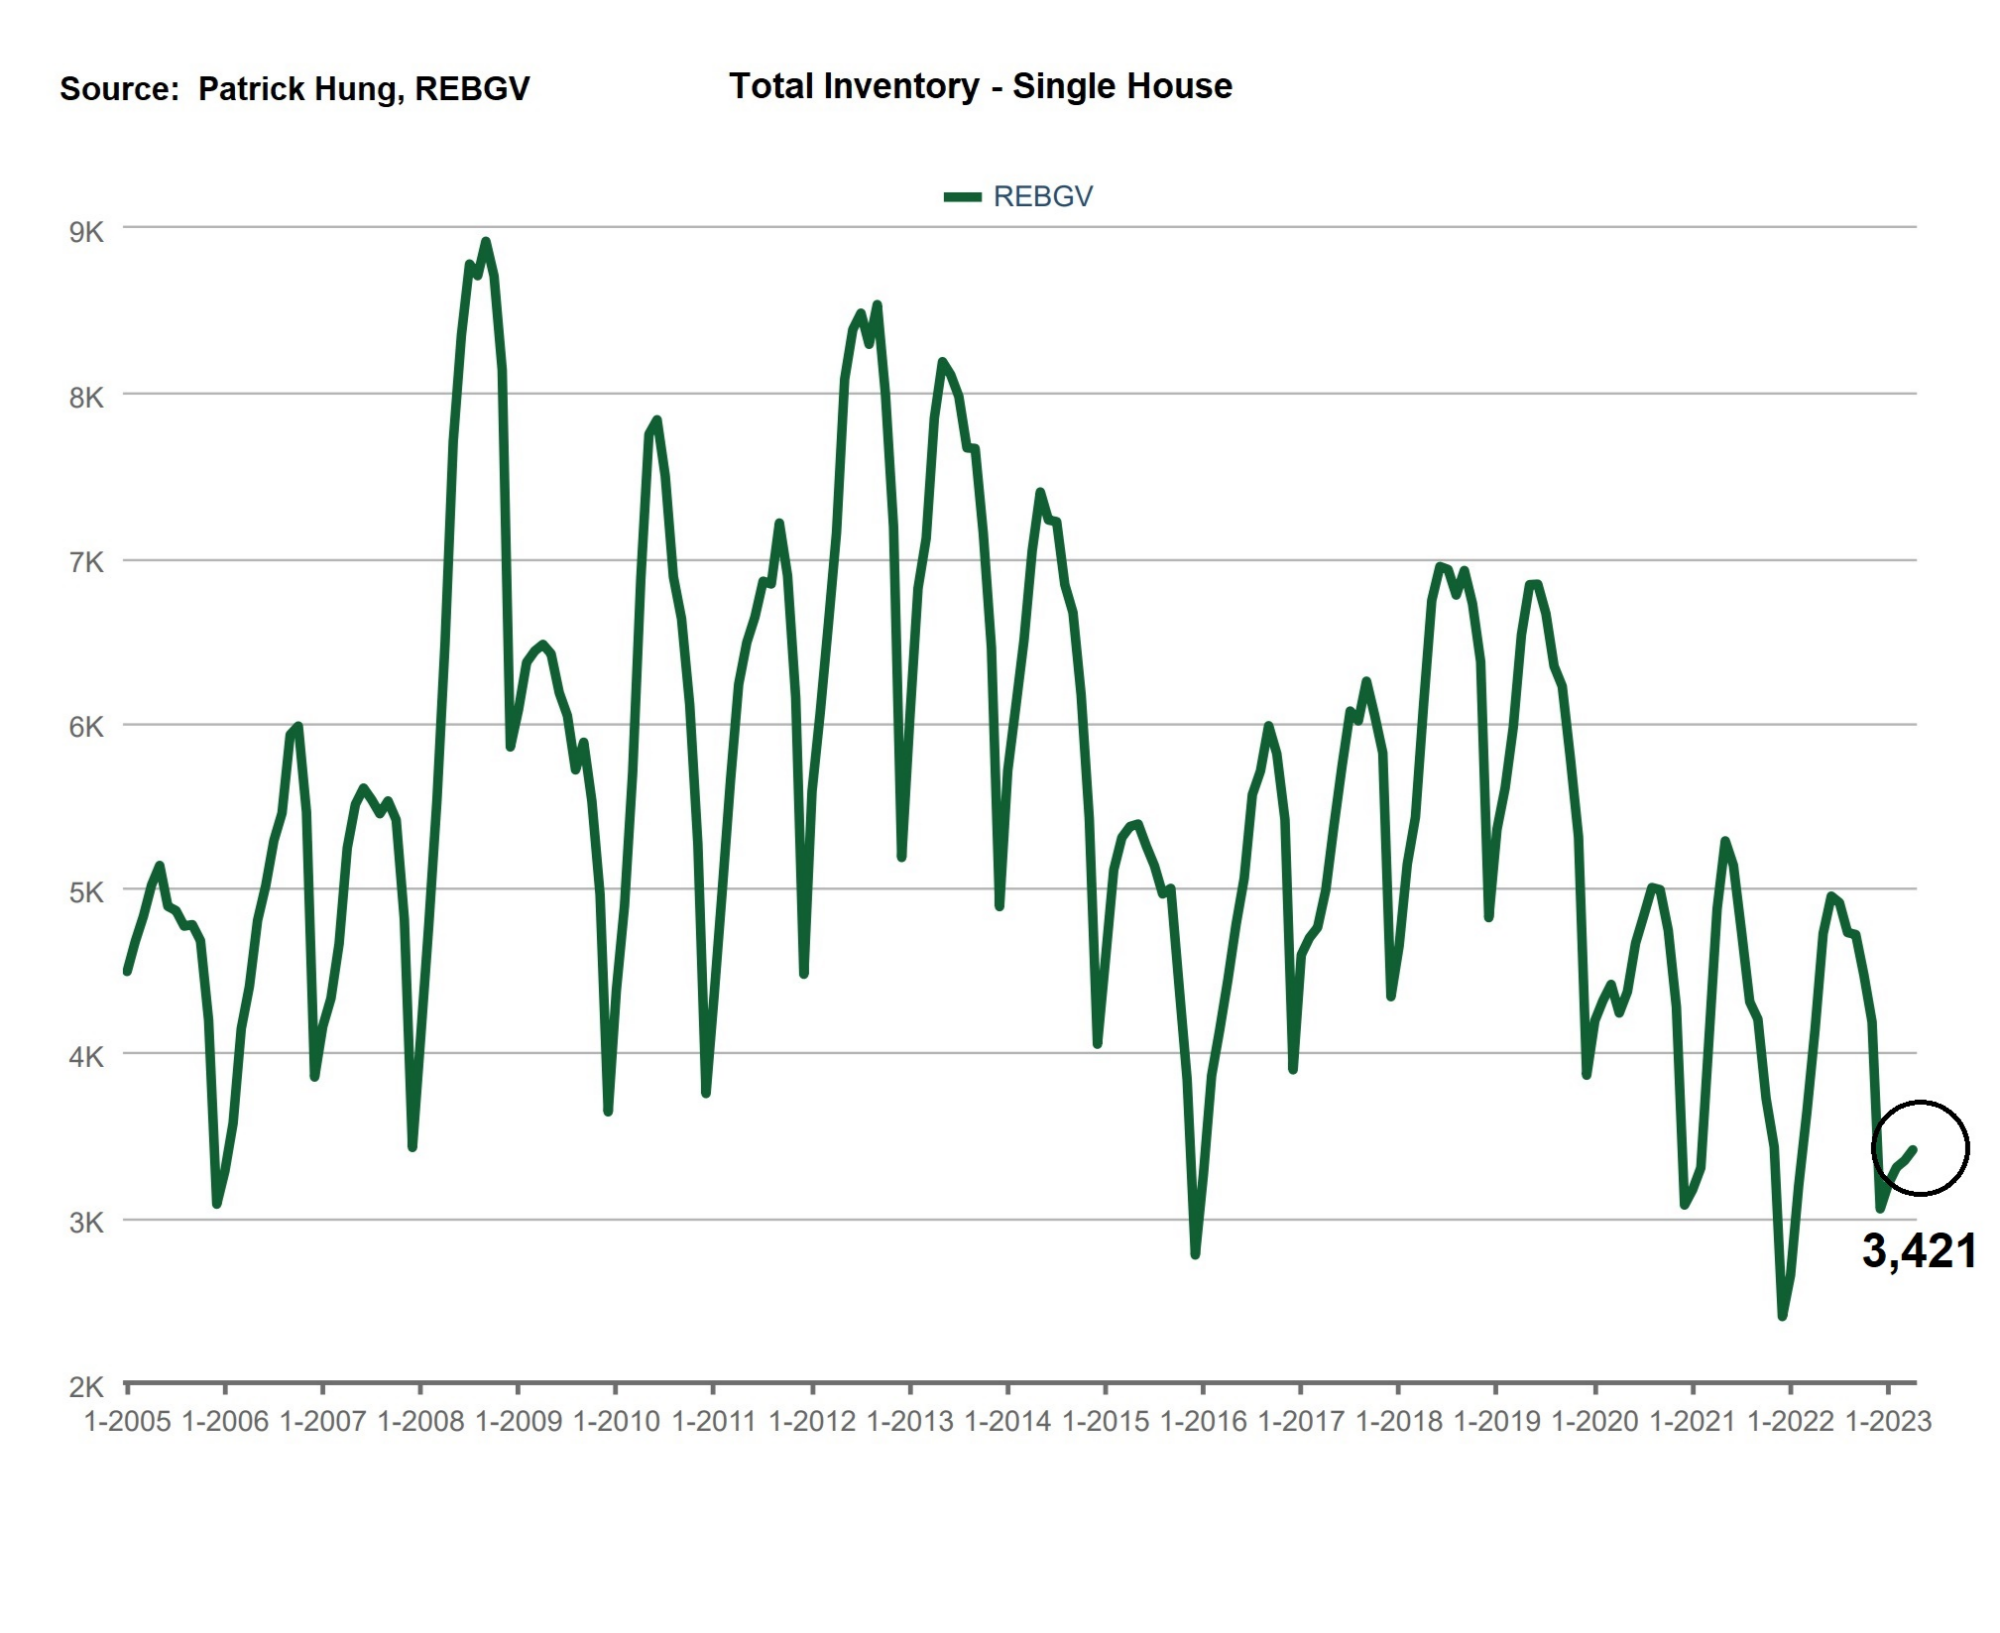
Townhouses are the blazing hot commodity now, and the numbers say it all. Last month, townhouses' sales to listing ratio (% of homes sold) is 40.1%, the highest among all property types. Prices also have climbed +2.1% in April, and is poised to continue that trajectory well into May. Inventory has gone DOWN, which is contrarily to the historical pattern. Again, this sets the stage for further price pressures with Greater Vancouver growing family's insatiable appetite for townhouses. Much like single houses, multiple offers in townhouses are still happening on a regular basis, and they usually sell in less than 1 weeks. Entry level townhouses under $1.2m (Burnaby/Richmond) and under $1m (Surrey/Langley) are selling like hot cakes. As many Vancouver politician have discussed, townhouse is the "missing middle", where supply is nowhere near demand. The only way to do so is, as proposed by David Eby, the premier of BC, to allow rezoning of all single houses in four-plexes. Having said that, such proposal will be implemented with details until this fall, and before that happens, we should see inventory continue to be constrained for the next few years. In April, the areas with the most townhouse price growths are in Vancouver West, Pitt Meadows and Burnaby South, with gains of +6.5%, +4.7%, and +4.4% respectively. Conversely, the neighborhoods with the most significant price drops are Tsawwassen, Ladner and New West, at -1%, -0.7% and -0.6% respectively. The townhouse market is pushing further into the Sellers market, with average days on market dropping slightly to 25 days (compared to 27 days last month). Month-to-month sale price has increased by +2.1% (compared to +1.7% increase last month). Sale-to-listing (% homes sold) ratio continues to climb to 40.1% (compared to 36.7% last month). 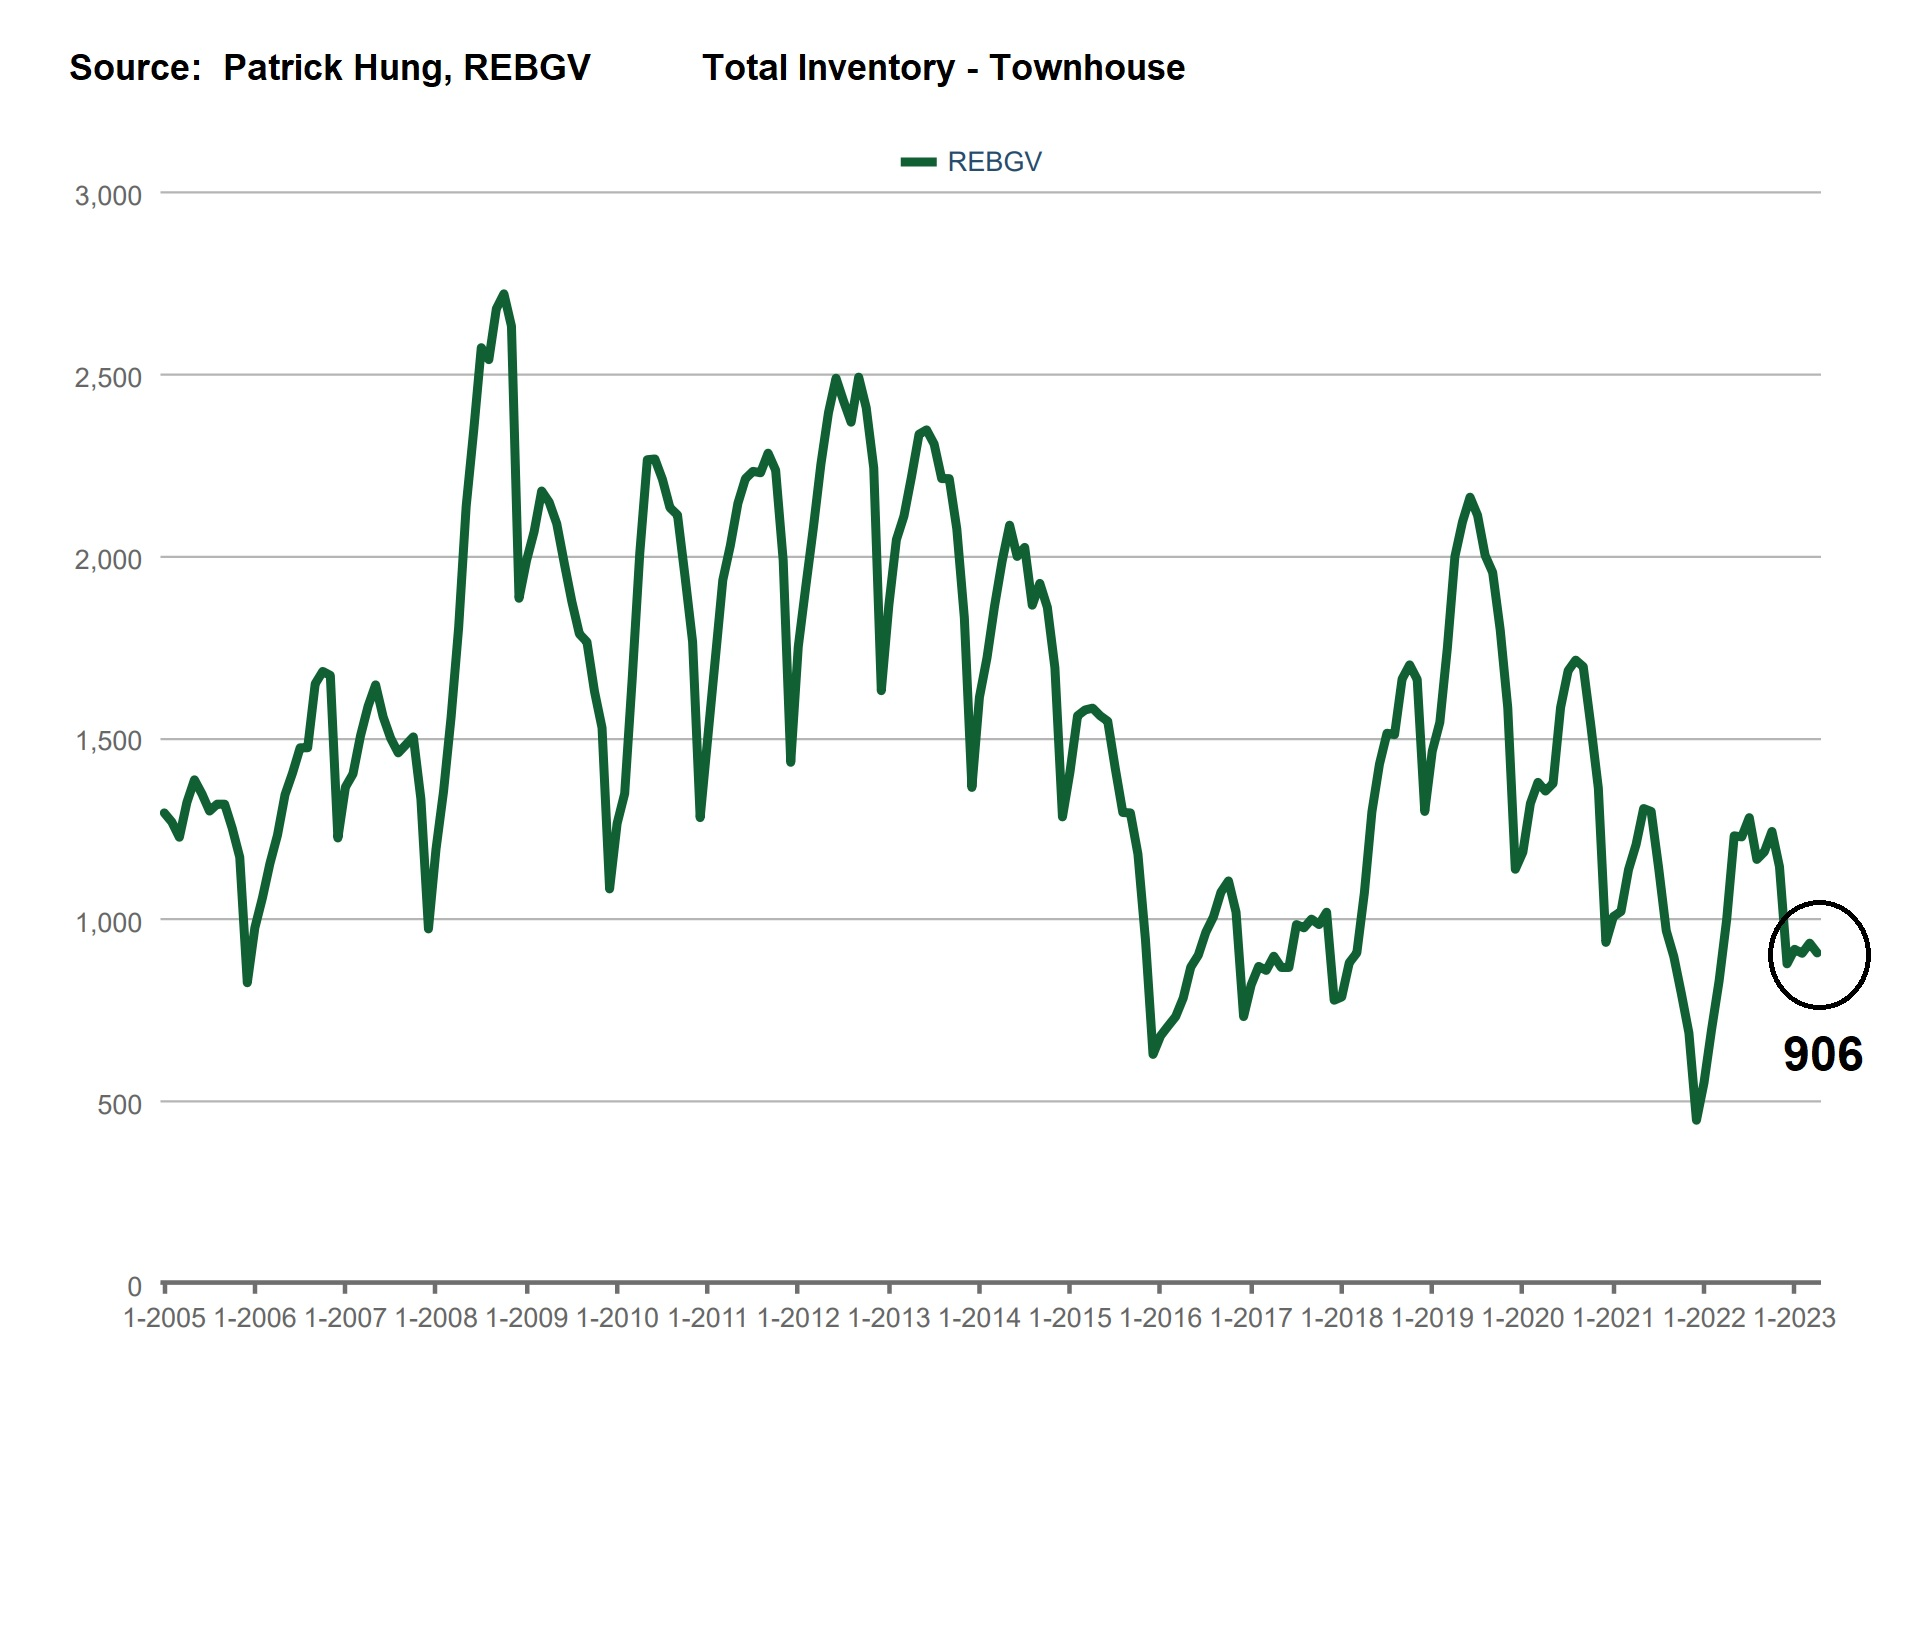
Apartment and Condo Market
The apartment and condo market is picking up steam in April, with multiple areas reporting over 50% of the apartments sold. Leading the pack is Ladner (86%), Port Coquitlam (82%), Port Moody (70%), New Westminster (63%) and Burnaby (55%). The rates has not changed much this year, so what has caused the Buyers to jump into the apartment market? In my opinion, the apartment market consists mainly of first time home buyers and investors. When they see there is hardly any supply in sight, then the anxiety starts to grow stronger by the week. Also, many Canadians are starting to realize that the later they get into the housing market, the harder it will be. That is just the harsh reality many first time home buyers face, so now they decide to make a move, regardless of the rate. The most popular price range for apartments remain under $700k in Greater Vancouver. However, multiple offers in this segment are not as common, although there are a few under priced homes that would attract a huge crowd. Listing to sales ratio (% of homes sold) is well over 70% for home below the $600k sweet spot in nearly all neighborhoods except for Downtown. The pre-sale scene continues to be on fire, as investor become more and more optimistic about the futures market. For the month of April, the best performing neighborhoods for apartments are Pitt Meadows, Maple Ridge and Richmond, posting +438%, +4.3% and +3.4% gains respectively. Conversely, the areas with the biggest price drops were all in the outskirts of Sunshine Coast, Whistler and Squamish, with -8.4%, -5.8%, and -5.4% respectively. The apartment and condo market shifts further into to a Seller's market, with average days on market dropping to 25 days (compared to 30 days last month). Month-to-month sale price is +2.0% (compared to +0.7% last month). Sale-to-listing (% homes sold) ratio has continues to climb to 37.4% (compared to 34.9% last month). 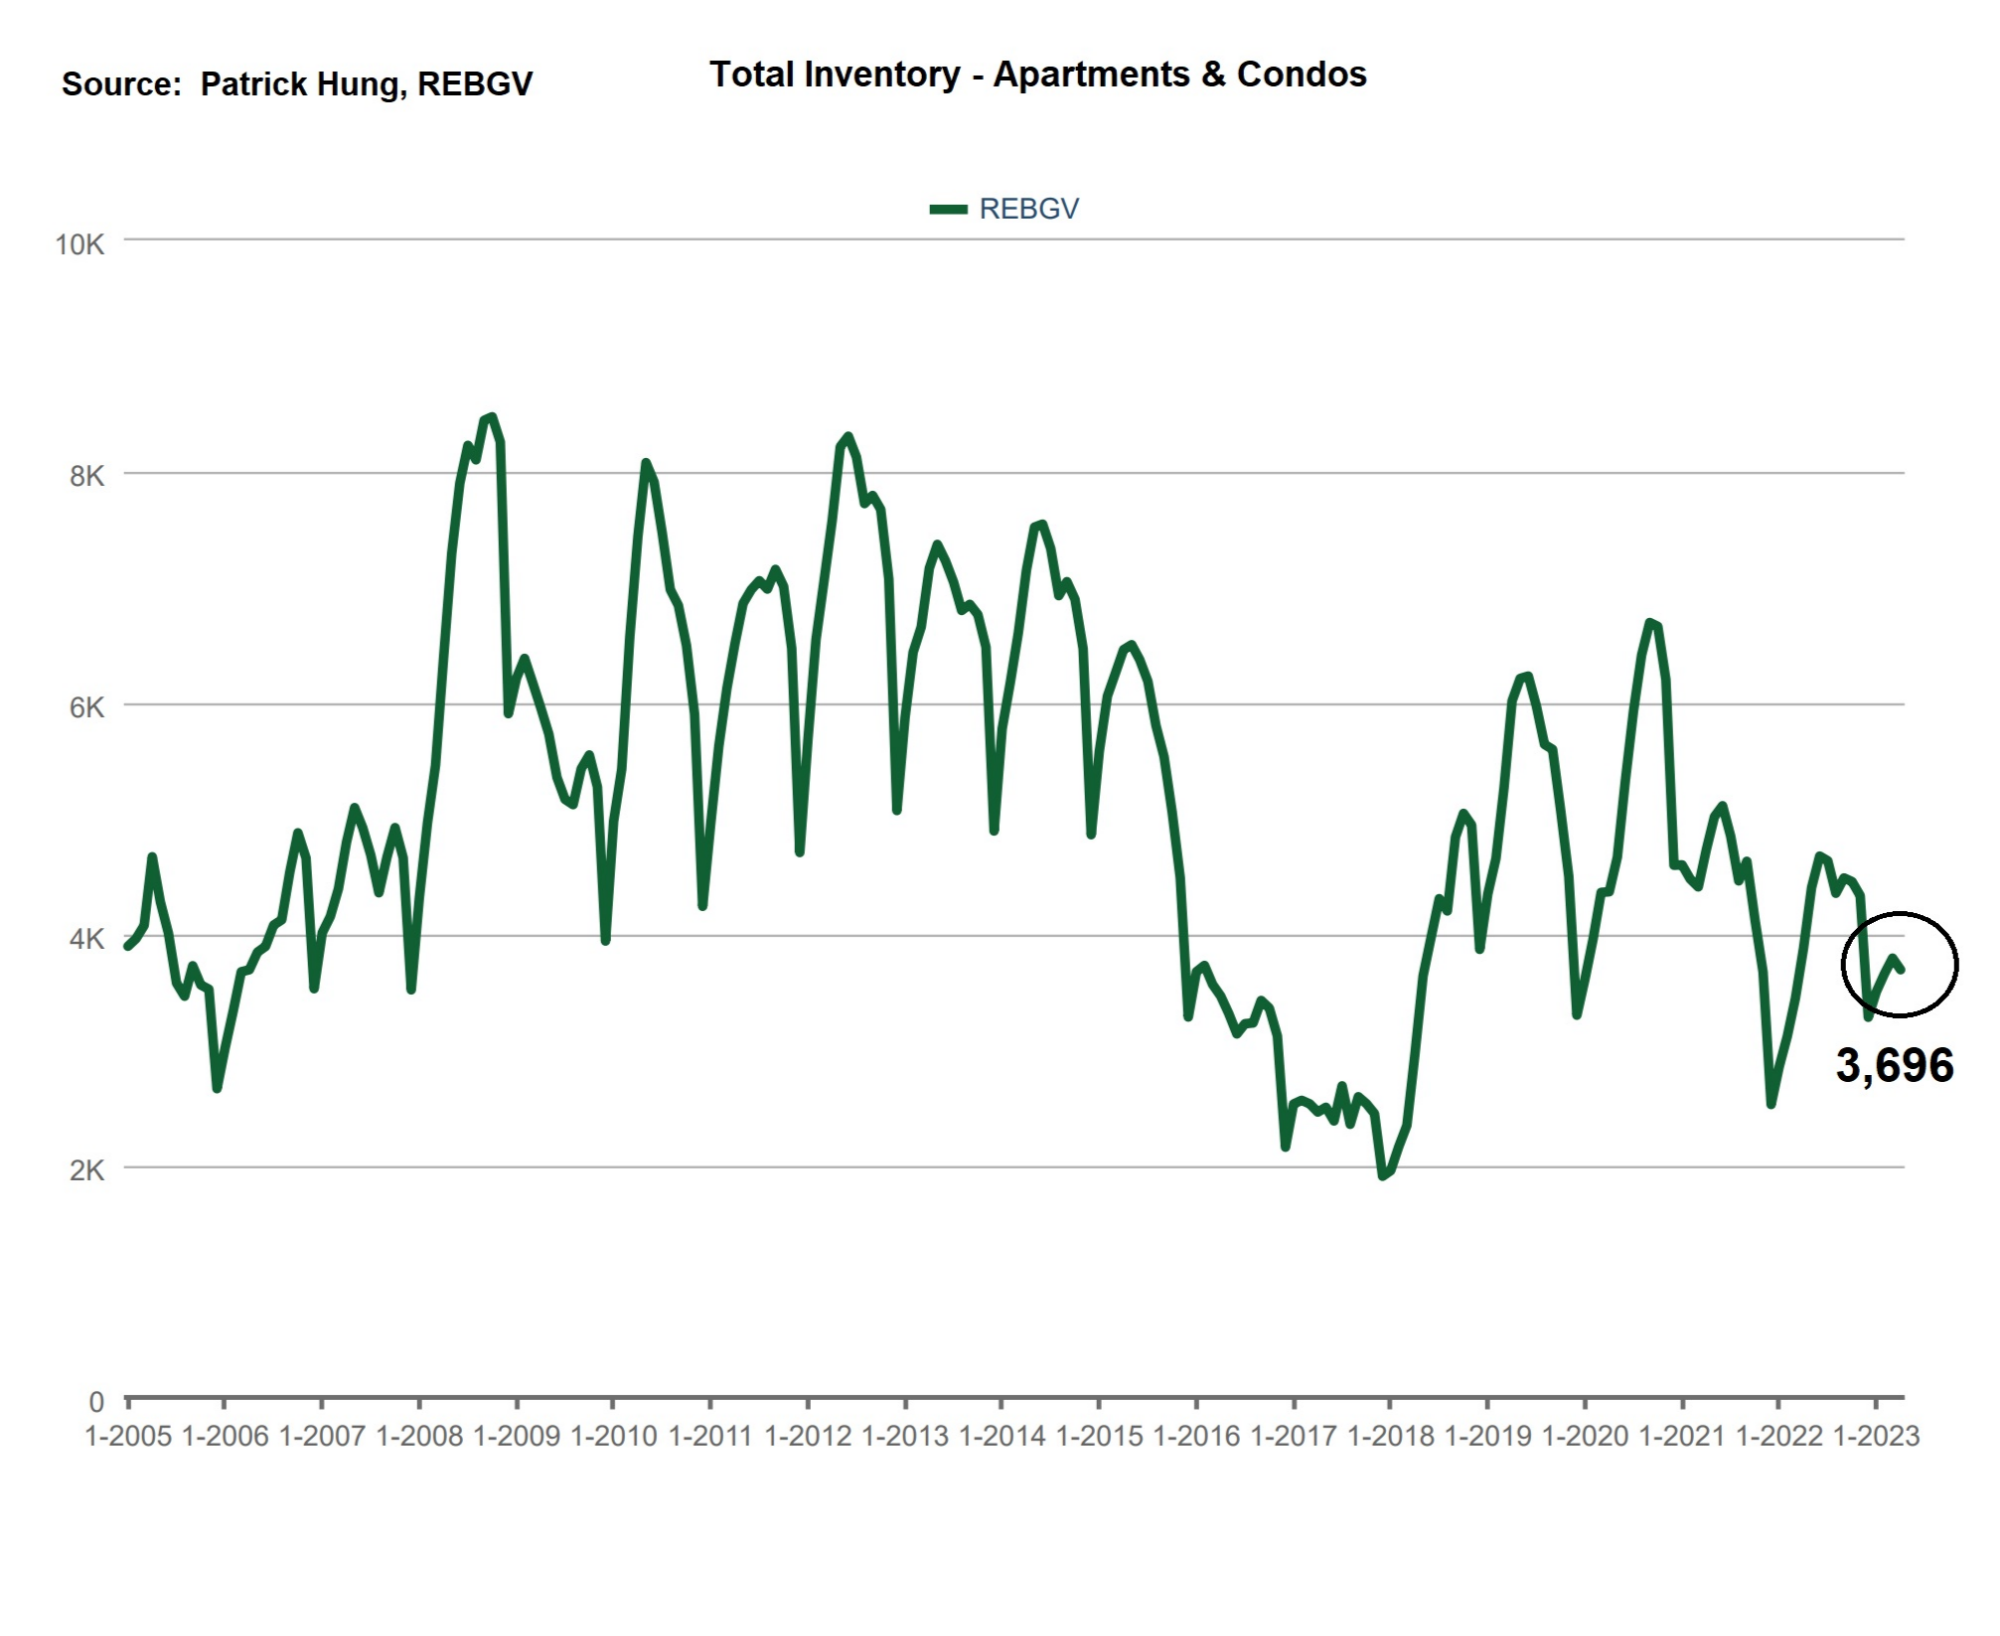
Here are the Three Trends I'm Observing:
1. Opposing Trends
Canadian housing starts and new builds are slowing at an alarming rate, from 261k units in 2022, to 211k unit in 2023 (projected). On the other hand, Canada is poised to welcome $1.9m new immigrants (both permanent residents and non-residents) this year. With these opposing trends, we are heading towards the biggest housing supply-demand crisis on record. Rental rates will continue to skyrocket, and we may see Greater Vancouver 1 bedrooms renting for $3000/month before 2028. (Source: CMHC, Bloomberg)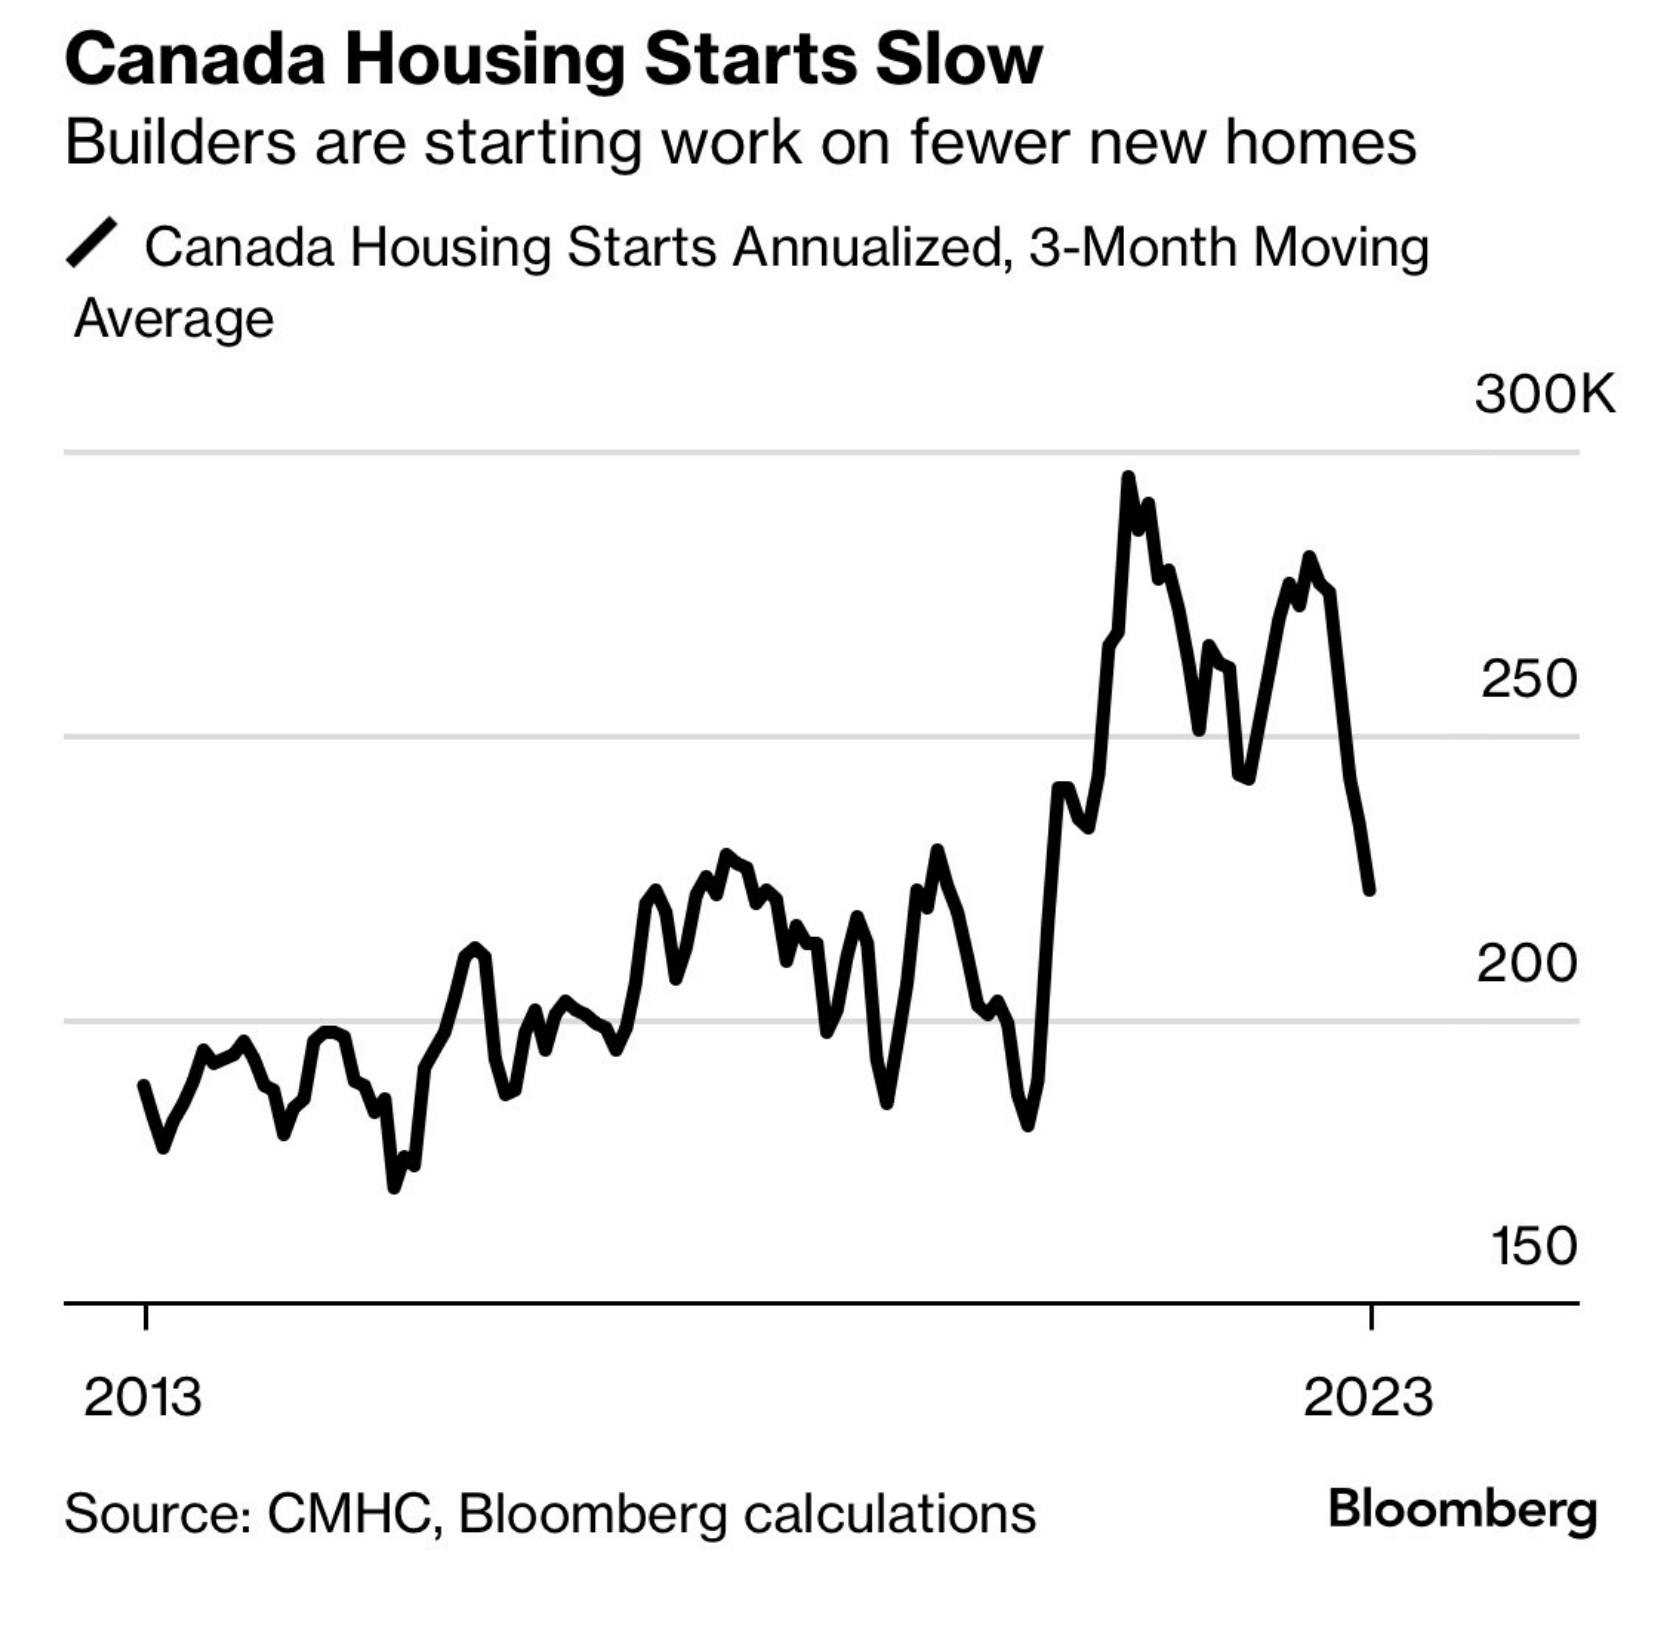
2. Optimism
The Canadian economy is addicted to real estate, whether on a taxation, GDP growth or an investment level. As Canadian real estate prices jump, the consumer confidence soars. (Source: Nanos, Bloomberg)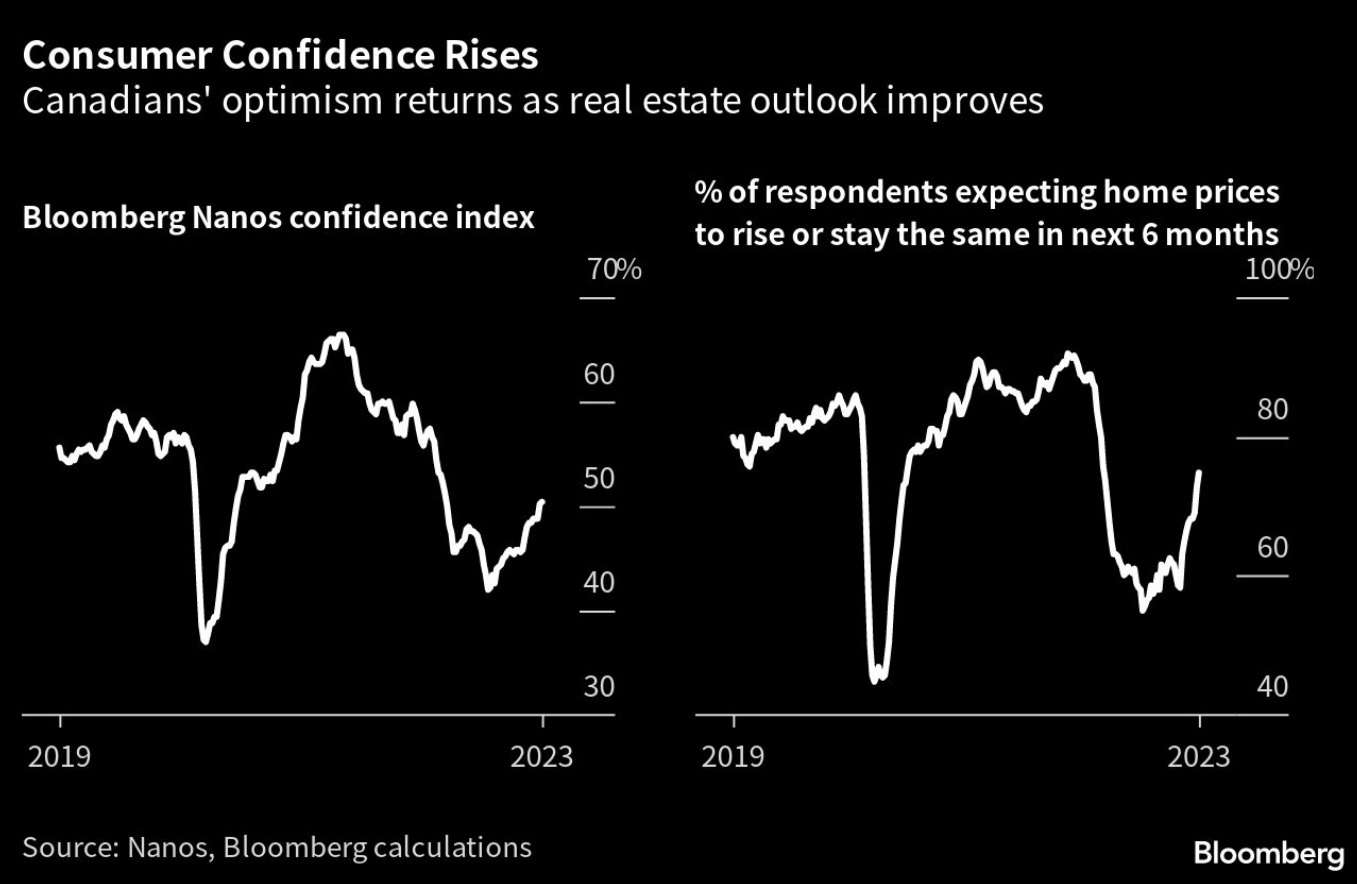
3. Quickie
It was only 5 months ago when many thought that 2023 is the year BC real estate would be in the gutters. Who would've thought that, year-to-date, we are already +9.6%? The scary part is, there seems to be no signs of slowing in the near future, at least not in the next 3 months. (Source: BCREA). 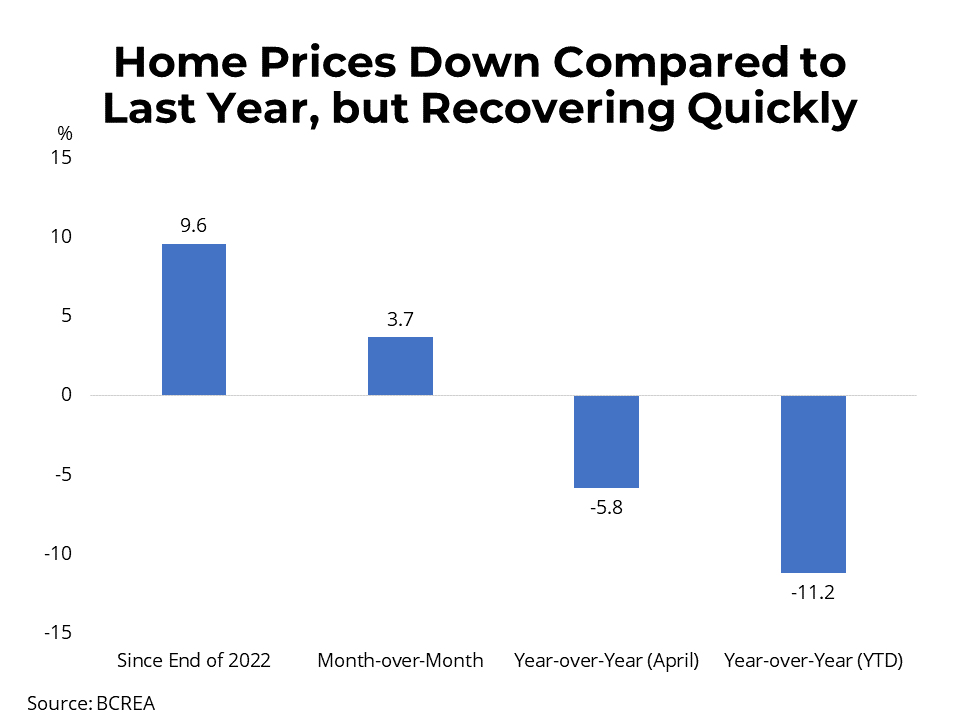
Recent Posts

GET MORE INFORMATION