

Real Estate Market Intelligence April 2026

Real Estate Market Intelligence April 2026
Mid-Spring is here and I hope you had enjoyed a gorgeous cherry blossoms we had for the past few weeks. As the weather gets warm, it certainly feels like summer is around the corner, but the the Vancouver real estate market remain in hibernation. With Q1 behind us, what we have observed is that the market, faced with ever-elevated uncertainty, continue to have Buyers sitting the sidelines. Thanks to Trump, in April 2025 we had tariffs, and this March 2026 we have oil shock. Typically, spring is the busiest season for Vancouver real estate (in terms of sales and volume), and it has been anything but that. Last month had the second lowest sales for March (first in 2019) in the past 25 years. When we account for all the immigration and population growth throughout these years AND still have such low sales, it just tells us just how weak the demand is. Again, factors such as the continual deterioration of the Canadian economy, compounded with shaken investors leaving the real estate scene, it was not hard to see why the Vancouver real estate will continue to face an uphill battle. Lots to cover this month as we see unemployment rate in BC spike to 6.7% (highest since pandemic) and already lost 36,000 jobs this year. On the contrarily, the US stock market continues to rip to new record highs, and Canadian bonds rates are edging higher and therefore pushing the fixed mortgage rates higher. Let's dive deeper.
For the Vancouver real estate market, 2026 has seen a lot of similarity with minor differences. What was different in March is that we saw a seasonal bump in sales, causing the months of inventory (accumulated inventory) lowering from 10 months in January to 7 months last month. We are starting to see the market went from a Buyers market and slowly shifting to a Balanced market. What was also atypical is that we saw NEW listings at +4.9% above the 10 year average, which means that Sellers are starting to take their foot off the gas and not flood the market as much. Another oddity is that the benchmark price has surprisingly shot up by +0.4% last month, which marked the first time in 12 months. However, on a macro level, March's sales was very weak at -31.8% below the 10 year average, and TOTAL inventory is still +38% above the 10 year average. The spread between the two is almost 70%, which almost guarantees further downward price pressure ahead. Anecdotally, we are starting to see more Sellers priced their homes sharper and lower, which is a sign that Seller have finally yet slowly come to their sense in accepting the new norm. On the other hand, Buyers with no urgency continue to observe and enjoy the market of lower prices. What's interesting is Buyers pre-approval fixed mortgage rates are seeing a bump from the mid 3% (60 days ago) to now above 4%. When these buyers have locked in their pre-approval rates for 90 days, will they come off the sidelines while they weight the options of higher rates vs. lower prices? That remains to be seen.
One of the key economic factors that affect real estate market is the unemployment rate, for which we saw BC came in 6.7% in March (on par with the Canada's national average). However, the difference is that Canada overall GAINED 14,000 jobs, while BC LOST 19,000 jobs. To put it into perspective, BC has been dragging the national average down by losing 36,000 jobs alone in the past 90 days. That means 400 jobs loss per day in BC, with hardest hit sectors in retail, wholesale trade, finance and real estate. Anecdotally, I am seeing more restaurants and retails closures very month, and more real estate agents are leaving than entering the industry. BC is already notoriously known for having the highest gas prices in North America, and with the recent oil price shock, just how much longer can businesses withstand the rapidly rising costs? On the contrarily, the stock market had a bit of a set back but is now back setting new record highs. This certainly rubbed salt to the wounds in the Vancouver real estate, where investors continue to stay away. What's interesting is that the current "higher stock price vs. lower real estate price" environment has created the perfect storm for first time home buyer and upsizers to move into the market. The investment funds in these buyers' portfolios have risen, and hence increasing their lump sump down payment and purchasing power. On the other hand, the lower real estate price are opening up more options (and inventory) for them. If I were a Buyer with a young family, this would be the perfect winds for me to set sail into my new home. But then again, job uncertainty are still affecting many Canadian families, so staying afloat seems to be the first priority for 2026.
With Q1 of 2026 in the books, there's so much to learn from yet continue to be in so much uncertainty. I feel that in order for real estate to regain its footing, things need to get back to normal and "boring" again. Buyers don't like uncertainty, and neither do banks. Tariff and oil shocks may be Trump's way to manipulate the stock market, but the innocent bystander that caught the stray bullet is the real estate sector. Segments such as single house may seem like it's normalizing, with a rare +1.1% price gain in March. Is that just dead cat bounce or the beginning or something new? Your guess is as good as mine.
Some of the unique trends I've been observing:
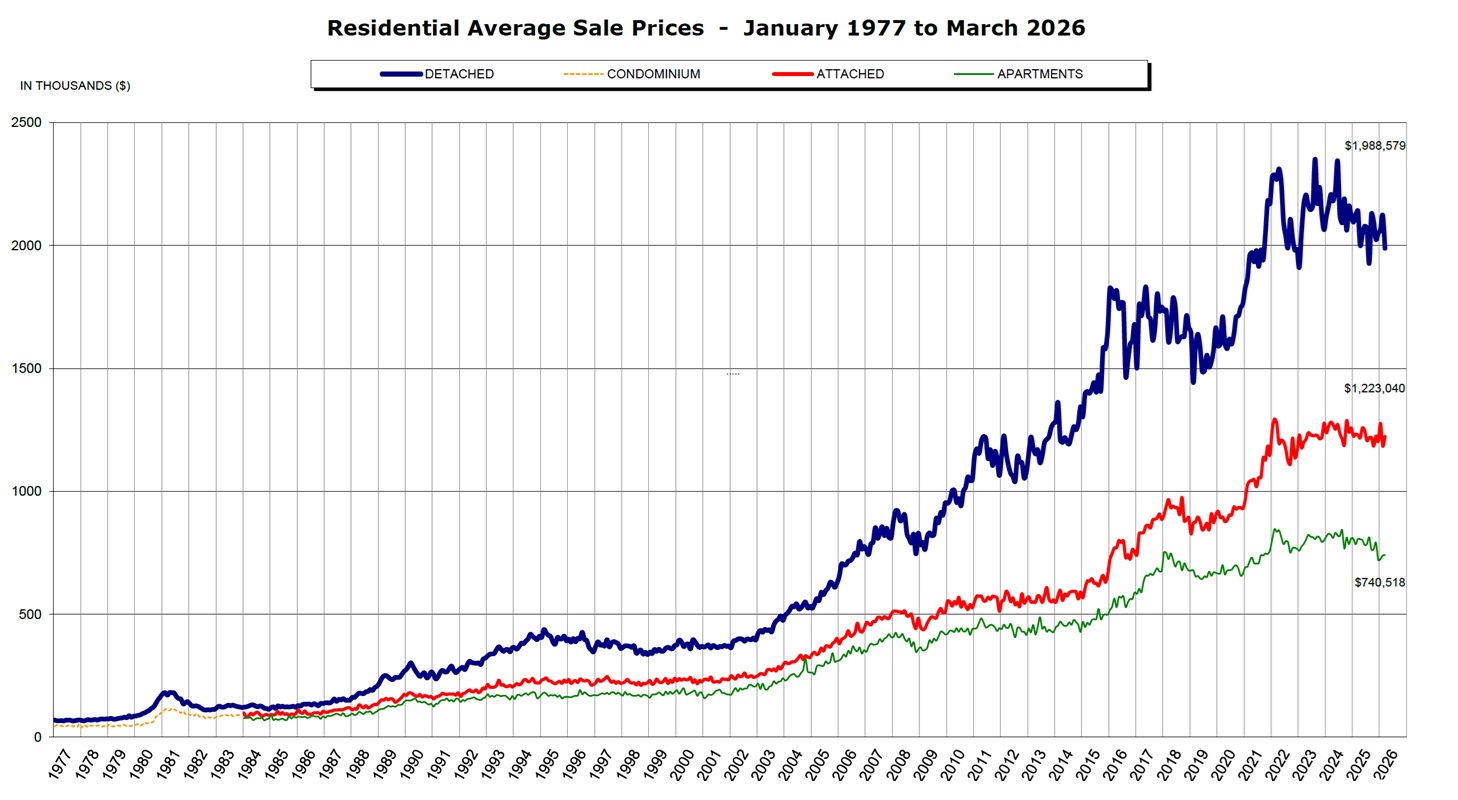
1. For the first time in 12 months, the Vancouver real estate market saw a slight increase in monthly price gain of +0.4% in March, mainly driven by single house (+1.1%), while townhouse remains flat at +0.1% and apartment still trending downward at -0.2%. For context, prices have dropped -6.8% in the past 12 months, but anecdotally it certainly feels like it has dropped more than -10%.
2. Maybe most are tired of the on-again, off-again news of the war in the Middle East, but the energy crisis is evidently affecting many countries, especially in Asia where rationing gasoline is reinforced; South Korea public workers are required to take public transportation to work on odd-even vehicle rotation system, and Philippines facing public transportation crisis with stoppages causing as many workers walking long distance to work. As the world we live in now are more inter-connected than ever, one thing seems certain is that global inflation is back to the forefront of the conversation. In Canada, we continue to see prices of chicken, ground coffee and beef edging higher, going from annual increase of +43.8%, +29.9% and +26.8% respectively. Worst part is, these price are still going up.
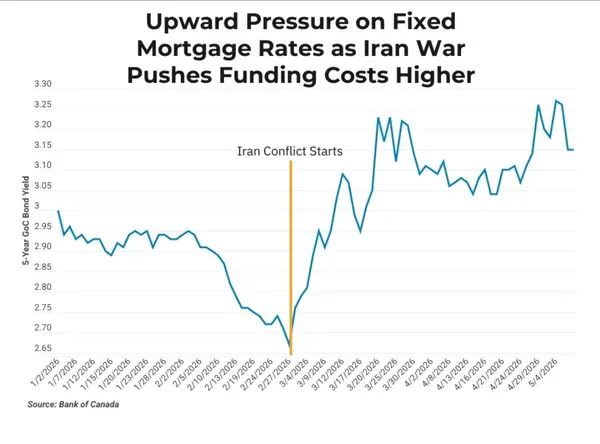
3. We are now 7 weeks into the US-Iran conflict, and the bond rates are rising due to the sustained energy inflation and increasing the likelihood of Bank of Canada rising rates. With that, the fixed mortgage rates (which mirrors that of the bond rate) having been rising as well, going from mid 3% and now to over 4%. It would be interesting to see how Buyers react to the "higher rates vs lower prices" trajectory. It is a realistic assumption that some per-approved buyers (with lower rates locked in) may pull the trigger and make a move.
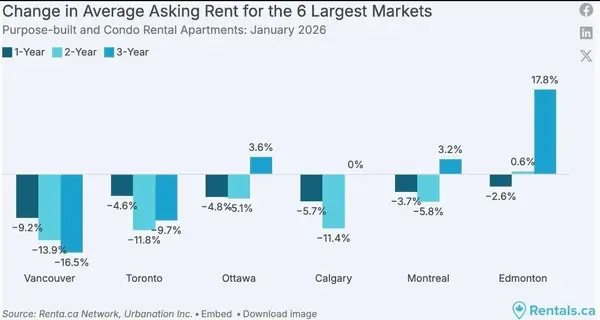
4. Rent in Canada have declined on an annual basis for 18 consecutive months, as well as falling by -1.1% on a month to month basis (compared to -1.3% in February). Across all major provinces, Ontario lead the charge in falling rent at -5.4%, followed by BC (-5.1%) and Alberta (-4.4%). With a net outflow of immigration and a first-ever shrinking Canadian population, there doesn't seem like an end more rent drops. Back then, it was tenants vs. tenants. Now, it's landlords vs. landlords.
5. In an attempt to bail out the pre-sale market that is underwater now, the provincial and federal government are giving tax rebates (or breaks) for new home purchases, at least in Ontario for now. In other words, a full 13% of HST are no longer applied for homes up to $1m, which translates into $130,000 savings for new home buyers. A part of me thinks it's a great plan to save the pre-sale market while helping out some first time home buyers, but another part of me thinks this is an abysmal social funding transfer program (from the federal government) to save the private development sector.
6. Canada's March unemployment rate remained the same at 6.7% (same as February). The key takeaway is the BC unemployment, which shed 19,000 jobs last month, and has lost 36,000 jobs so far this year. In other words, that's 400 job lost per day. Sectors that got hit the hardest include manufacturing, retail, wholesale, finance and real estate. As I had reported in January that Canada expected to lose 4000 restaurants this year, now we are starting to see that materialize. As more businesses fold, we should see more Canadian home foreclosures surge, especially BC and Ontario.
Here are the 3 highlights for March:
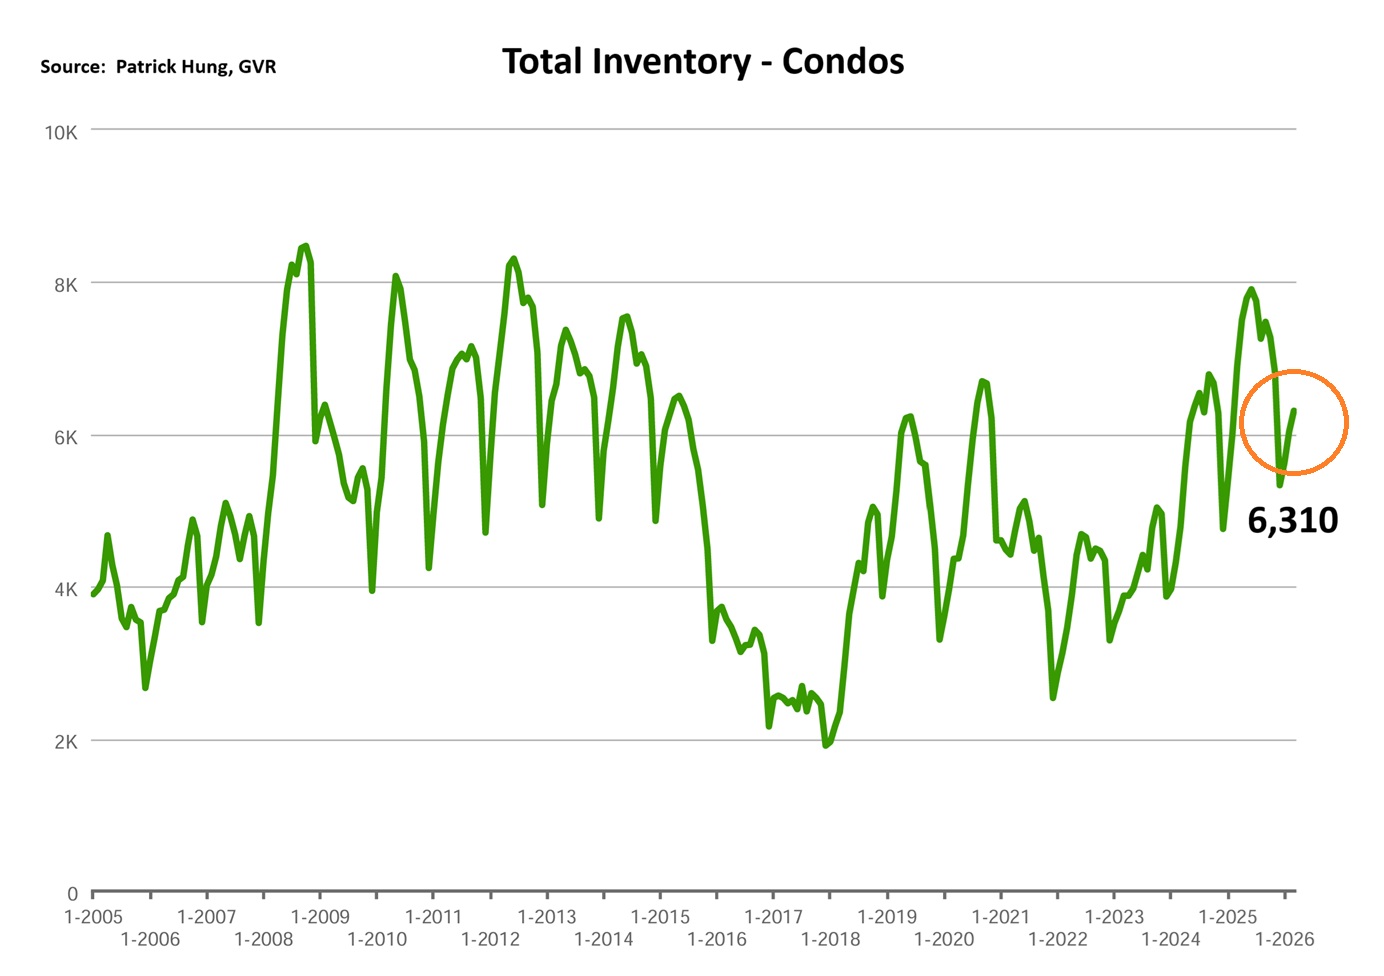
- Total inventory of 14,350 units is the sixth highest March's total inventory in the past 21 years. New listings are starting to slow as Sellers ponder trying some other time. The gap is between supply is demand is closing, but this could be seasonal as well.
- Entry level single houses are starting to gain traction in Metro Vancouver, while apartments sales are still lagging. Single house was the sole highlight of the month, with monthly price gain at +1.1%, which outpaced both townhouse and apartments. Markets remain highly polarized.
- After 12 months of continuous price drop, the benchmark home prices has finally registered a a gain of +0.4% in March (compared to -0.2% in February). This brings the total of 0.9% price drop in the past 3 months. As the Middle East conflict is starting to a constant toss-up, would any prolonged news good bring back some Buyer confidence in the real estate market?
Here are the in-depth statistics of the March:
- Last month's sales were -31.8% below the 10 year March's sales average (compared to -28.7% in February). Q1 this year has hoovered around -30% below average.
- Month by month residential home sales increased by +4.5% from March.
- Month by month new home listings increased by +21.6%. This may seem like a lot, but Spring and March is typically when the most listings are coming out of the woodwork.
- Last month's price increased by +0.4% (compared to -0.2% in February)
- Sales-to-listing (or % of homes sold) ratio is increased significantly to 14.2% (compared to 12.6% in February). By property type, the ratio is 11%, for single houses, 17.2% for townhouses, and 15.7% for condos.
Download March 2026 Real Estate Market Report
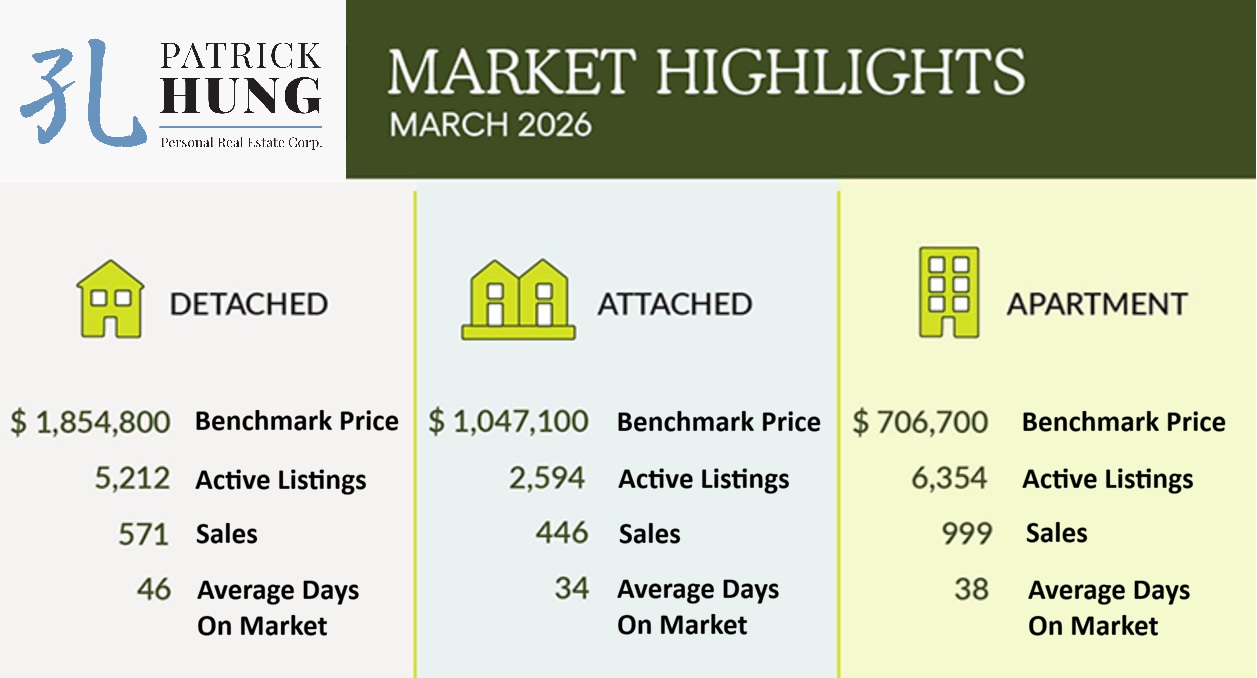
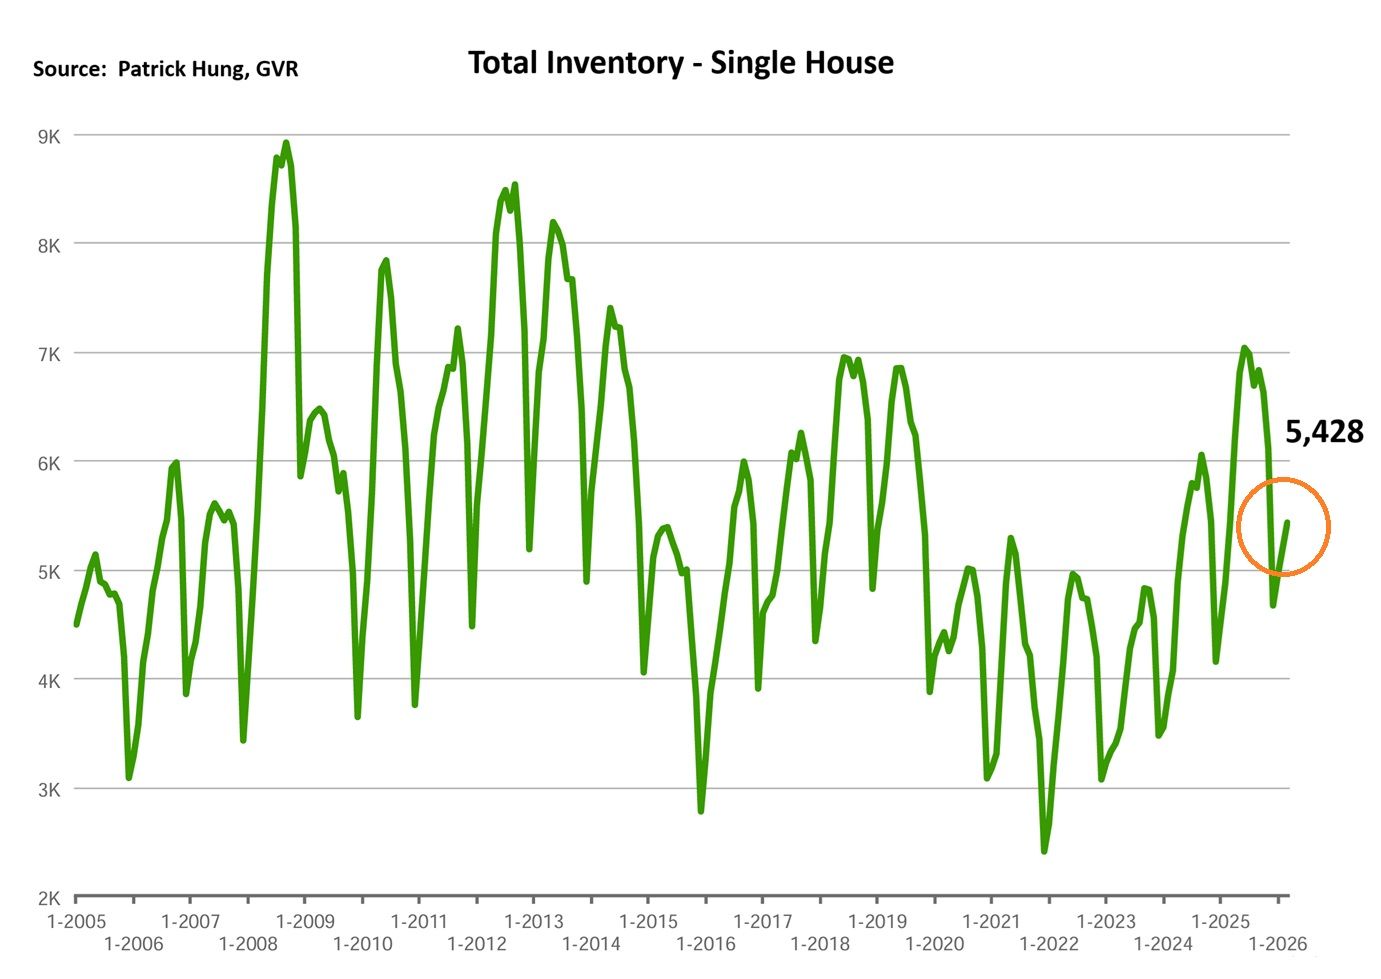
Single House Market
Last month, the single house market lead the charge with a +1.1% monthly price gain (compared to townhouse +0.1% and condo -0.2%). Digging deeper, it was only in February that the single house price dropped by -0.8%, so the fluctuation between the two months is just almost breaking even. The micro trends in neigborhoods are even more polarized. For example, we are seeing the sales-to-listing ratio (% of homes sold) in areas such as Surrey and Burnaby hoovering at a lower 8% and 9% respectively, and remains sluggish in a Buyer's market. On the other side, single houses in Ladner and Pitt Meadows are ripping higher, with sales-to-listing ratio at 26% and 25% respectively and is firmly grounded in a Seller's market. Again, real estate is always hyper local. As we can see, Ladner is sandwiched between Richmond and Tsawwassen, but the sales ratio is as below: Ladner (26%), Richmond (10%), and Tsawwassen (10%). So there must be something that attracts Buyers to Ladner, correct? In my opinion, this is entry level home price point issue. Average home price in Ladner ($1.29m) is much more affordable Richmond ($1.97m) and Tsawwassen ($1.51m). While these 3 neighborhoods are all within 15 mins drive from each other, it would just make that much more sense for families to upsize in Ladner than other areas. Thus, we begin to see entry level homes getting bids in Ladner, but not so much in Richmond nor Burnaby. As most Canadian families still see single house with a front and backyard as an ultimate goal (and also to build equity), I can image that the single house segment could begin to rebound sooner than others.
For the month of March, the neighorhoods that registered most price growth were West Vancouver, North Vancouver, and Pitt Meadows, posting +5.5%, +4.1% and +4% respectively. Conversely, the neighborhoods registered the most significant price drops were Whistler, Squamish, and , with -3.5%, -2.4% and -0.7% respectively. The single house market remained in the Buyers market, with average days on market improving slightly to 46 days (compared to 49 days in February), and month-to-month average shot up for the first time in 12 months at +1.1% (compared to -0.8% in February). Sales-to-listing ratio (% of homes sold) increased to 11% (compared to 9% in February).
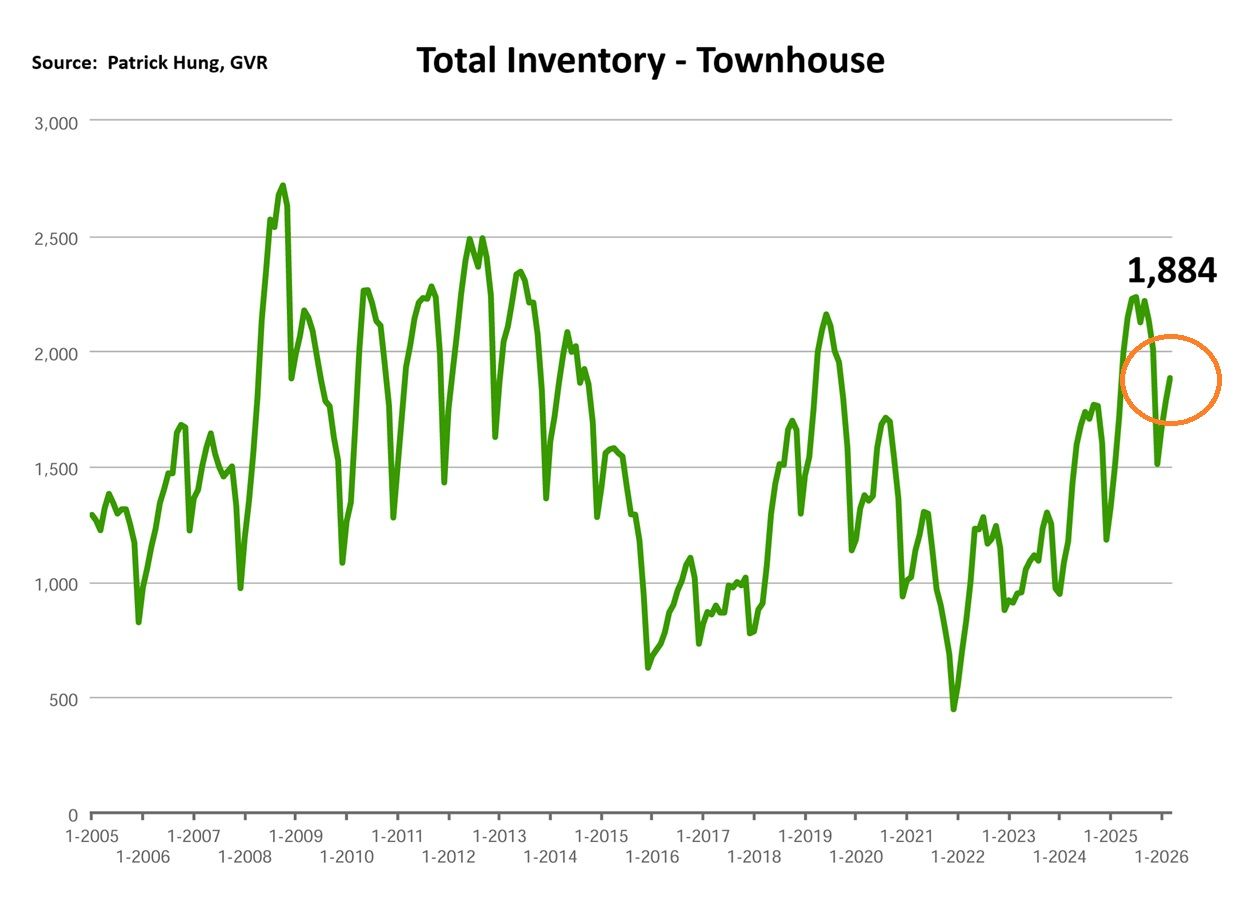
Townhouse Market
The townhouse market has been chopping sideways and remaining nearly flat this year. Last month's benchmark price barely moved at +0.1%, while the 3 month price change has only slightly dropped only -0.9%. Even though overall inventory remains elevated, we are starting to see signs on a slow down of new listings (fresh supply) in March. This may play a bit of a stabilizing factor in terms of price this segment. Key is, entry level townhouse, such as those around $900k in the suburbs like Richmond, Ladner, and Burnaby are getting quite a bit of attention and traffic. For this same reason, the townhouse sales-to-listing ratio (% of homes sold) is 17.2% for March, which is the best across all property types. The townhouse market have a tendency be highly affected by the apartment market, where apartment sellers (young families looking to upsize) turn into townhouse Buyers. Thus, when the apartment market improves, so does the townhouse sales. Anecdotally, the townhouse segment in neighborhoods such as East Vancouver and Burnaby are facing more and more competition from the now-completed multiplex (4, 6, 8 unit) homes. These multiplexes continue to corrode the townhouse segment, as they are newer and have a lower price per square feet (better deal). However, the biggest drawback continues to be the parking issue (townhouse covered parking vs. multiplex open or no parking). I expect more of such competition to heat up in the next 12 months. Keep in mind that multiplexes are more of an municipal/provincial experiment, and we are seeing some developers pull out after their first project due to a combination of higher-isk and lower-profits in the development space. Perhaps we may see these multiplex builds come and go, and townhouse may come back into being the top-of-the-mind upsizing choice after 12-18 months.
In March, the areas with the most townhouse price growths were Port Coquitlam, Burnaby East and Coquitlam, registering +4.4%, +2.1%, and +0.9% respectively. Conversely, the neighborhoods with the most significant price drops were Vancouver West, Tsawwassen and New West, at -1.9% (tied of 1st and 2nd) and -0.9% respectively. The townhouse market remained in a balanced market, with days on market increasing slightly to 34 days (compared to 33 days in February). Month-to-month sale price has posted minor gains for the past two months at +0.1% (compared to +0.2% in February). Sale-to-listing (% homes sold) ratio also improved slightly to 17.2% (compared to 16.6% in February).
Condo Market
In March, the condo market actually had the worst performance in terms of price, being the sole segment that posted a monthly price drop of -0.2%. Total condo inventory remains the main factor, even though last monthly only posted a slight jump due to seasonal factors. The main concern in the condo market remains where supply is plentiful, and the difference between units are minimal. It is easy to compare condo developments within the same area, given the similarity in layout, size, design, and amenities. It is much easier for buyers to gauge the price of a 10th floor unit compared to a 5th floor. For this reason, it may only take one panic investor/seller to go on a fire liquidation sale, and thus setting the new benchmark price for other Buyers to follow. On the pre-sale sector, things went from bad to worse as developers went from bankruptcy, to now bulk selling. By that, they are selling hundreds of units under market value. Such pre-construction condo supply are already spiking in 2026, and with more to come. Projects such as Oakridge mall, which is slated to be completed later this year, will add thousands of homes in the area. For those who remember, Oakridge Mall condos pre-sale price was on average $2,500 per square feet, which means 500 sf 1 bed 1 bath would cost $1.25m, with GST and property transfer tax on top, effectively taking it over $1.3m. For those who have invested or bought in this project, I can say that there's a very high chance of seeing a minimum 25% equity loss here. If I had bought an Oakridge pre-sale unit, and I paid 20% deposit down in the hopes the prices would jump, but now at completion I see a 25% of my value vanished? Would I still complete, or just walk off with the possibility of getting sued by the developer? Expect similar bulk sell cases to pop up more frequently this year.
For the month of March, the best performing neighbourhoods for condos were in Vancouver East, Port Coquitlam and North Vancouver at +2.5% and +1.4% (tied for 2nd and 4rd) respectively. Conversely, the areas with the most significant price drops were mainly in West Vancouver, Sunshine Coast and Ladner, posting -6.5%, -3.5% and -3.2% respectively. The condo segment remained in a balanced market, with average days on market dropping slightly to 38 days (compared to 40 days in February). Month-to-month sale price reversed back to the negative at positive at -0.2% (compared to +0.5% in February). Sale-to-listing (% homes sold) ratio increased significantly to 15.7% (compared to 14.1% in February).
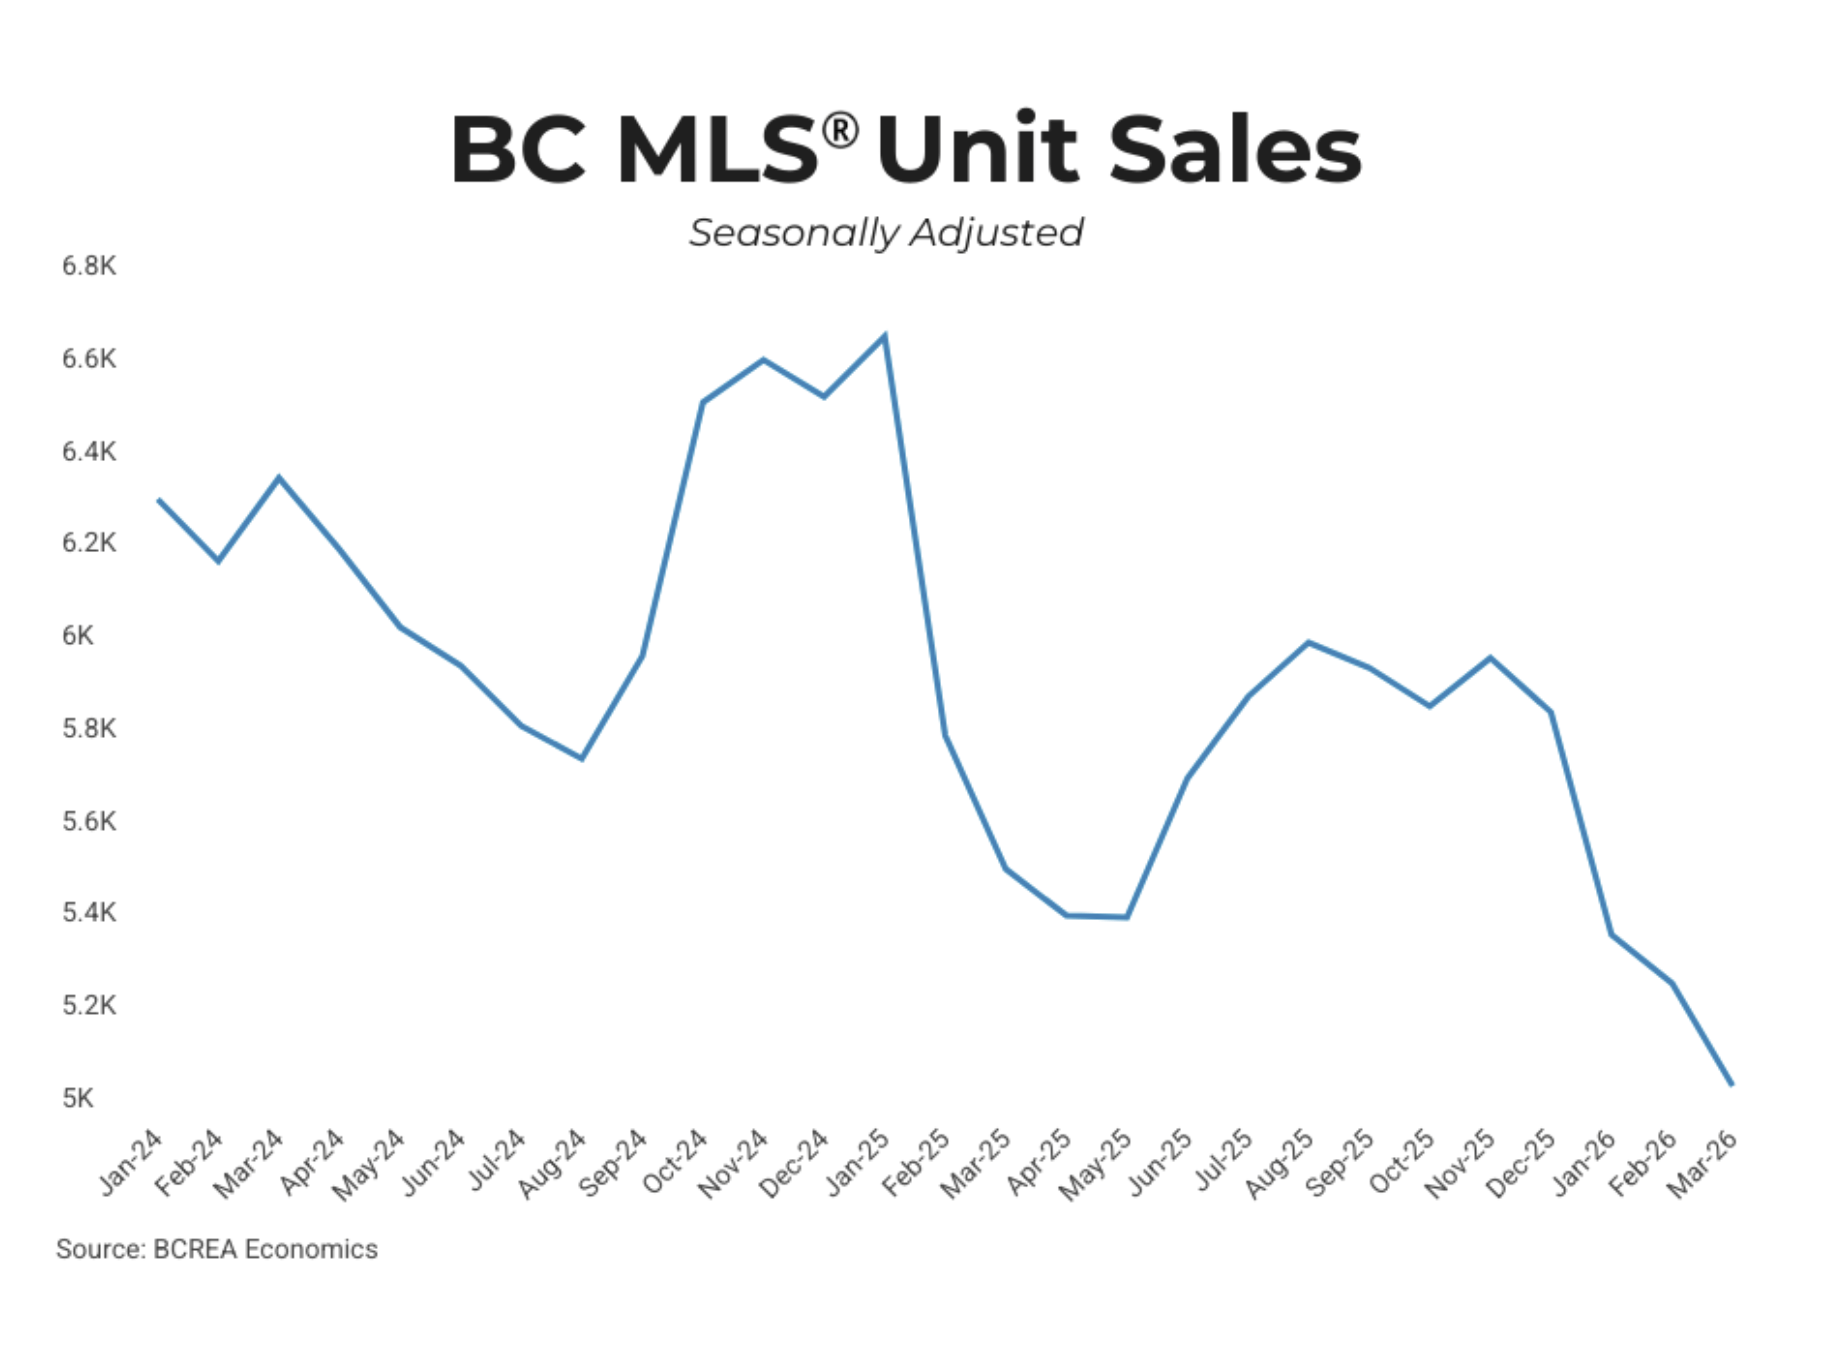
1. Smell The Coffee
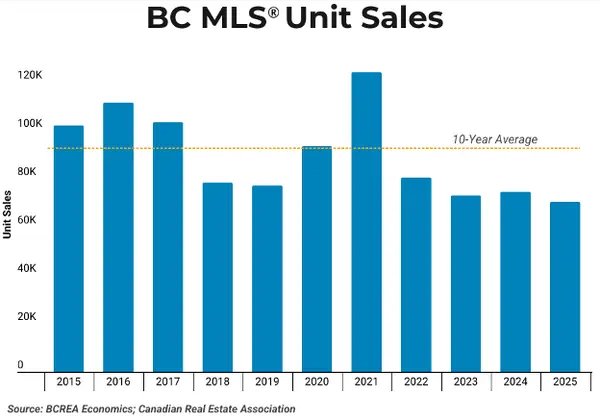
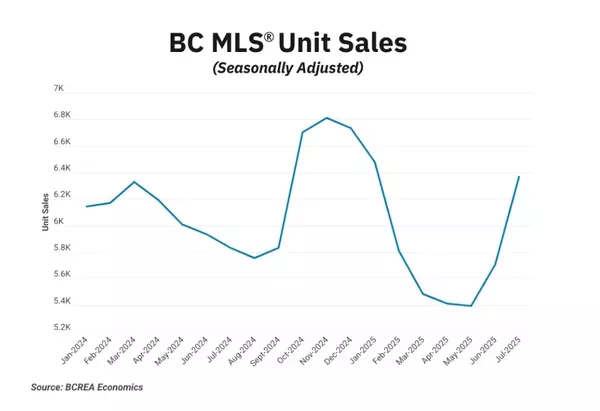
If you think the tariff news in April 2025 shook the real estate Buyers, think again. Just when many thought the market would recover, the recent oil shock continues to break the Vancouver real estate sales to 25 year lows. Any optimistic Sellers still out there? Time to wake up and smell the coffee. (Source: BC Real Estate Association Economics)
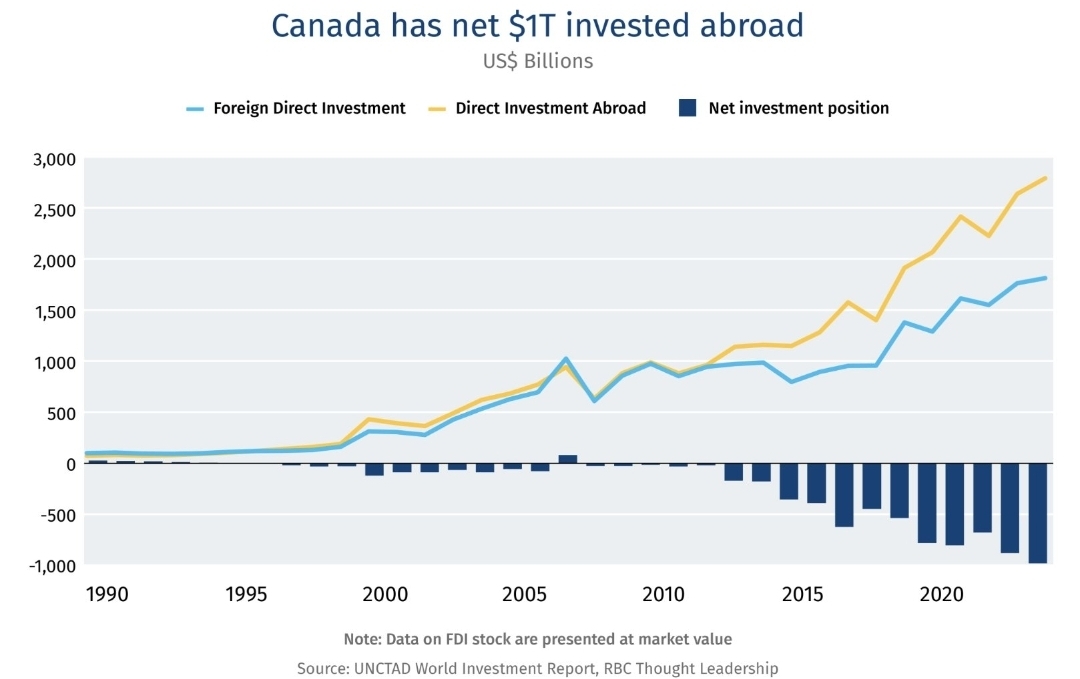
2. Good Bye Investors
Between 2015-2026, for every $1 investment made INTO Canada, $2 of investment has LEFT Canada. We have now witnessed the great exodus of capital during the Trudeau era. It will be a monumental task for Prime Minister Mark Carney to clean up this mess, and by the looks of it, the capital exit is looking to accelerate further in 2026. Buckle up: it's going to get worse before it gets better. (Source: RBC Thought Leadership)
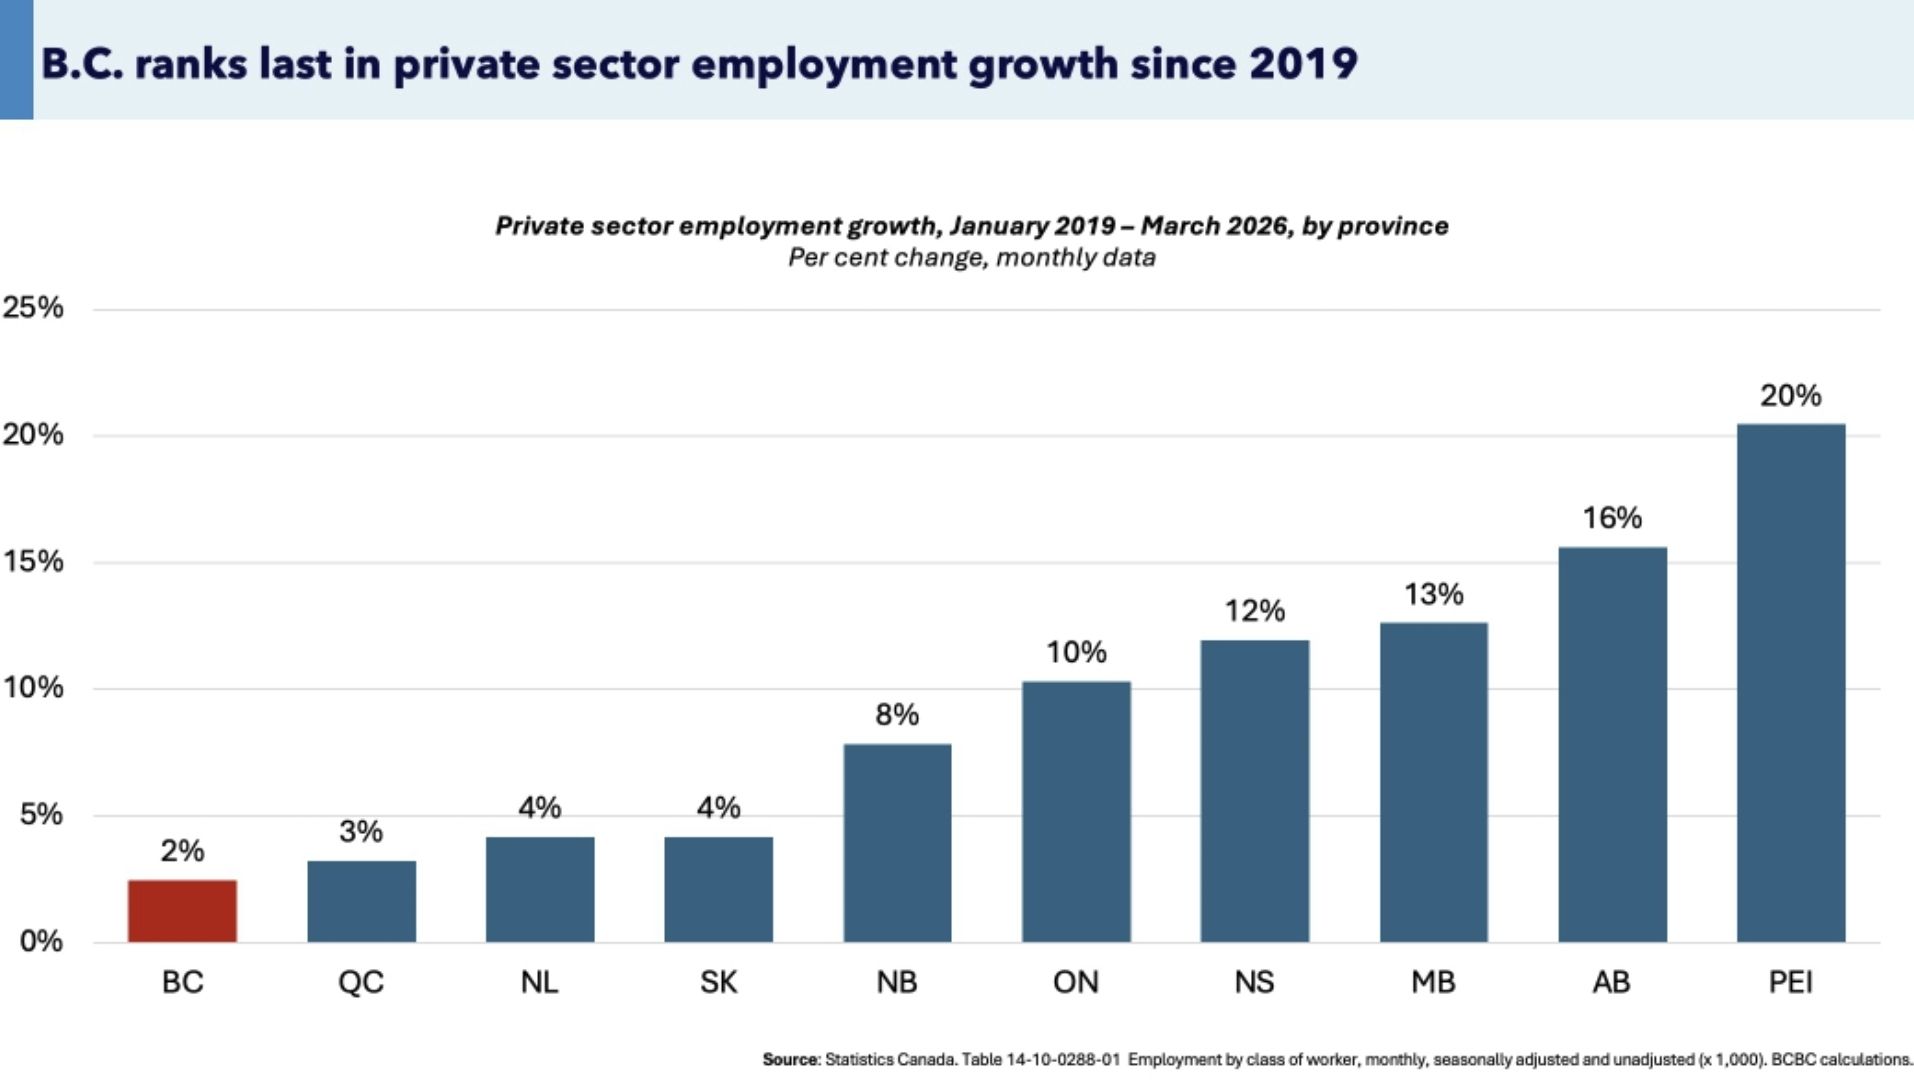
3. Growth?
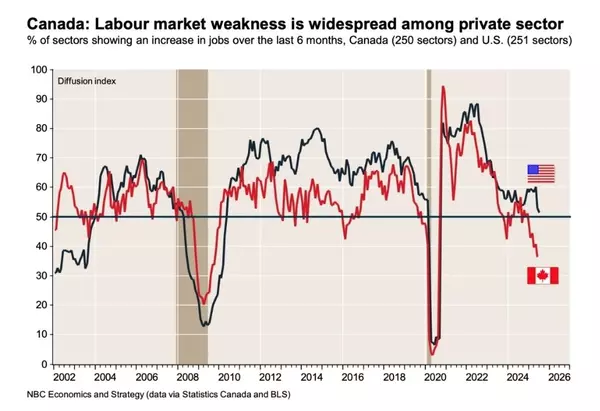
For the past 6 years, BC ranks dead last in Canada in terms of private sector employment growth at only 2%. Ontario is faring better at the mid-pack at 10%. Not only is Canada losing its competitive edge, but BC is losing all kinds of business confidence. Keep in mind this time frame also coincides with the NDP being in power in BC since 2017. With so little growth and homes still unaffordable, maybe that's why BC residents are leaving for Alberta? (Source: Statistics Canada)
Recent Posts


GET MORE INFORMATION