

Real Estate Market Intelligence August 2026

Real Estate Market Intelligence
August 2026

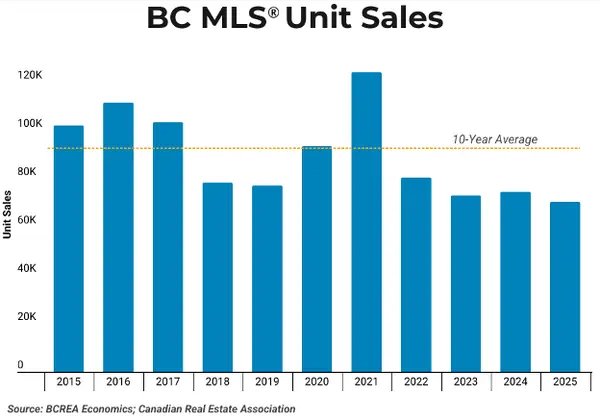
Mid-Summer in Vancouver is always full of outdoor activities, with kids out of school and families going on camping and overseas trip mode. In the face of increasingly volatile times, last month's Vancouver real estate sales recorded the second slowest month of July in 25 years, hitting -18.6% below the 10 year average. For context, June's monthly sales was nearly +10% above the 10 year average. In other words, the market moved one step forward and two feet back. Lots to cover this month as we see the the real estate market as a reflection of the heightened volatility in the Canadian economy. On one hand, July's unemployment rate fell to 6.4% (down from 6.5% in June) and marked the lowest jobless rate in two years. Secondly, Canada's July inflation hit a 3%, which is the highest since 2023. What's more important is the newly imposed US tariff of 50% on Canada goods worth approx $20 billion, with deadline creeping up on Aug 19th. Let's take a deeper dive.
The thought of a Vancouver real estate recovery was quickly vanquished in July, as monthly sales acted like a swinging door and and hit back harder -18% than the +10% gained in June. Furthermore, the monthly price change has accelerated, from June's slight drop of -0.1% to July's full -1%. The balancing factor was that new listings (fresh inventory) has dropped -11.5% from July 2025. In short, we have less inventory, less sales, and further price drops. Considering all these mixed factors in the market, it has become increasingly hard for both Buyers and Sellers to gauge any transactions. Anecdotally, the overall lower inventory have provided less choices for Buyers, at the same time having less competition for Sellers. This has helped cleared some stale inventory that has been sitting on the market for a few months. The logic behind the lower inventory can be multi-fold, with some sellers dropping out after being discouraged from the lack of offers or traffic. Other Sellers may have taken their real estate agents' advice and taken it off the market in August for a reboot, and re-launch them in September as a final push for the last quarter of the year.
As we know that prices are a lagging indicator of the market, it will take many more months of lower inventory continues in order to se price stabilization. Moreover, we we see the sales-to-listing ratio (% of homes sales) dropping to 13% (down from 14.6% in June) across the board. Single house took the hardest hit, with many markets now moving from balanced market back to a Buyer's market. Keep in mind that this is normal in slower seasons (deep winter and summer months), but this year has been marred by anything but normal, with contradicting forces and stats all over the place.
For the Canadian economy, July's unemployment rate came in at 6.4%, which was down from 6.5% from June. Pleasant surprise, right? That's what Mark Carney and Doug Ford (Ontario Premier) has claimed. However, if we dig deeper, this stat is completely skewed in two provinces; Albert and Saskatchewan, which accounted for +2.6% of the employment growth (since 2025). For the rest of Canada, it's only +0.1% with the same time frame. There's no denying that two booming provinces in Canada are carrying the country, but for the Ontario premier to come and claim the fame while the provinces are going through a manufacturing downturn in mind boggling.
On the note of economic downturn, the uncertainty jacked up another level with the newly levied US 50% tariff on Canada, affecting over $50 billion worth of goods. For this reason, many manufacturing, such as Stellantis (auto sector's giant in Brampton, Ontario) has considering shutting down or selling their plants. This will further plunge the economy into further recession. As Mark Carney's government continue to iron out a deal with the US counterparts, the deadline is fast approaching on Aug 19th. It awaits to be seen if it's another TACO (Trump Always Chicken Out) strategy, but either way, Canada will need to pivot hard and fast if the fallout with the US deteriorates further. Ultimately, the middle class Canadians are paying the price, and Mark Carney knows it too.
As of the time of writing, the war in Iran has been ravaging on for nearly 5 months. Oil prices remain elevated, and the Canadian latest inflation has hit 3%, which is the highest since 2023. More mixed signal as US stock market continue to hit record highs. It sure is concerning as we see similar markets in other parts of the world, such as the Korean stock exchange KOSPI, hitting record high in June 19th by surpassing 9,000 points, just to draw back in July 30th to 5,593 points, effectively evaporating 35% of the market. Did you know that the Seoul real estate also surged 9% year-over-year. As the global bubble has ballooned to an enormous level of no return, something eventually will have to give, and real estate will likely be dragged into the picture. Meanwhile, stay cool in another record breaking hot mid-summer.
Some of the unique trends I've been observing:
1. The Canadian Overseas Buyers ban on real estate will effectively expire on January 1, 2027. As many developers across Canada are urging the federal government to abolish this, I believe this is another smoke screen, and the ban will eventually expire quietly. Did you know that overseas buyers made up less than 1% of the total transaction in Canada? Which means even if such policy expires, there will hardly be anyone overseas rushing to Canada to purchasing a home. Why? Overall Canadian real estate prices are still dropping, AND Overseas Buyer TAX will remain (20% in BC and 25% in Ontario). Overseas Buyers are not stupid, so to assume that they will "save the Canadian market" is just pipe dream.
2. Canada's July unemployment rate came in at 6.4% (down from 6.5% in June). Both Mark Carney and Doug Ford (Ontario Premier) were playing the cheerleader on this "great news". But when digging deeper, it was Alberta and Saskatchewan that carried the team, posting +2.6% in employment growth since 2025, while the rest of Canada grew a measly +0.1%. If you live in BC or Ontario, then you know how this new "drop in unemployment rate" sounds so far away from truth.
3. "One step forward, two feet back" is how the Vancouver real estate market has been for the past few months. Last month's sale was the slowest July in 25 years, hitting -18.6% below the 10 year average, while in June was nearly +10% in the other direction. This teeter-totter action has confused the Buyers and Sellers alike. Not only the sales, but sales prices too, are all over the map, with June's drop at -0.1% while July fell even further to -1%. There's just no way to time or gauge the market in this wildly volatile market.
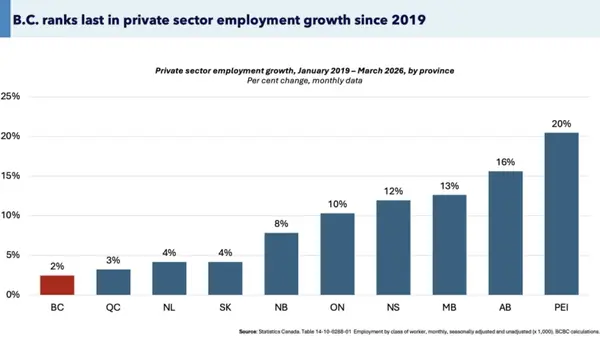
4. Business in the private sector continue to take a beating and are leaving Canada, while government-adjacent (education, health care, social assistance) business are the only sector that's carrying the country since 2023. What has happened?
5. Realtors in Greater Vancouver continue to leave the industry in troves. As of the time of writing, there are 13,730 agents, down nearly 10% from only 18 months ago from 15,200 agents. Anecdotally, top producers are still doing well, but those that do only a few deals a year are likely not going to renew their license.
Here are the 3 highlights for July:
- Total inventory of 16,476 units is the 7th highest July's total inventory in the past 21 years. Signs of softening inventory continued from June through to July. As such, Buyers are now facing less choices, while Sellers are facing less competition. However, this may be short lived as typically Sellers will prepare to make a final push for a sale before the year ends. Expect inventory to rise again in September through October.
- Price drops had been slow and steady for the past few months (-1.5% from Jan to June). Then July took over and dropped a full -1% for the month.
- Buyers who are in the market now are seeing some of the best upsizing opportunity since the pandemic. With prices rolling back close to 2021 levels, those who are financially capable and willing will likely make the move, especially in the single house segment. In some neigborhoods like New Westminster, Richmond and Ladner, some entry level single house has reached anew low at $1.3-$1.4m.
Here are the in-depth statistics of the July:
- Last month's sales were -18.6% below the 10 year July's sales average (compared to -12.4% in June). Demand took a sharp turn downward and has erased any gains from June.
- Month by month residential home sales dropped -5.6% from June.
- Month by month new home listings dropped by an astonishing -18.7%. Part of it was due to seasonality, while some disgruntled Sellers may simply decided to take their home off the market altogether.
- Last month's price drop by 1% (compared to -0.1% in June)
- Sales-to-listing (or % of homes sold) ratio remained relatively flat as well at 13% (compared to 14.6% in June). By property type, the ratio is 10.5% for single houses, 15.8% for townhouses, and 14% for condos.
Download July 2026 Greater Vancouver Real Estate Report

For the single house market, one of the main concerns in July was how the market shifted gears dramatically from a balanced market to a buyers' market. Oddly enough, the total inventory also fell. Such strange dynamic favoured neither the Buyers nor the Sellers, but merely pushed the market forward into even more uncertainty. For many area like East Vancouver, Richmond, Burnaby, Ladner, and New Westminster, we saw the July sales-to-listing ratio (% of homes sold) pulled back by 2-3%. Popular areas such as North Vancouver went from a seller's market to a balanced one. Anecdotally, single house are still selling in the summer, but it HAS to be a good product in a desirable neighborhood, PLUS is sharply priced. Missing either one element, and it will bound to sit on the market for months. Buyers remain extremely selective even facing a lower inventory. As seasonal summer months of lower inventory give way to fresh supply in Autumn, I would expect some Buyers who's been looking for a while to pull the trigger in the next few months. But then again, anything can happen in this wildly volatile market.
For the month or July, the neighborhoods that registered the most price growth were Sunshine Coast, Pitt Meadows, and Port Moody, posting +1.9%, +1.8% and +1% respectively. Conversely, the neighborhoods registered the most significant price drops were Tsawwassen, Squamish, Whistler and Pitt Meadows with -4.2%, -3.9% and -3.6% respectively.
The single house market has shifted from a Balanced market to a Buyers market, with average days on market increasing slightly to 42 days (compared to 39 days in June), and month-to-month sales price dropped further to -1% (compared to -0.3% in June). Sales-to-listing ratio (% of homes sold) slipped to 10.5% (compared to 12% in June).

Townhouse Market
The townhouse market took a blow in terms on pricing last month (-1.5%) after having the least monthly price drop across all segments in June (-0.2%). This was like taking seven steps back. Just when one might thought the townhouse market was starting to stabilize, prices took a sharp U-turn. Anecdotally, townhouse prices have to come down MORE than the single house in order for it to attract buyers. Why? As single house prices drop, it has reach a level where some upsizing Buyers can bypass the townhouse step in their climb up the property ladder. In other words, Buyers who are financially capable will sell their 2 bedroom condo (i.e for $800k), then skip purchasing a townhouse, but instead head directly into purchasing an entry level single house (i.e for $1.4m). As such, the townhouse buyer pool may have shrunk. Another factor to consider was the emergence of the multi-plex (4-6 plex), where they are newer, more affordable, and with no strata fees. Such an option has actually attracted many of my younger clients, and I believe will be a trend for many years to come. Having more options is always ideal for Buyers, just not so in terms of townhouse prices or sales.
In July, the areas with the most townhouse price growths were Richmond, Tsawwassen, and New Westminster, registering +1%, +0.3%, and -0.2% respectively. On the other hand, the neighborhoods with the most significant price drops were Vancouver East, Burnaby South, and Port Coquitlam at -4.4%, -3.3% and -2.8% respectively.
The townhouse market remained in a balanced market, with days on market nearly flat at 33 days (compared to 35 days in June). Month-to-month sale price dropped significantly to -1.5% (compared to -0.2% in June). Sales-to-listing ratio (% of homes sold) dropped to 15.8% (compared to 17.8% in June).

Condo Market
On the surface, the July condo market was having another sub-par month, registered a monthly price drop of -1.1% and a sales-to-listing ratio (% of homes sold) at 14%. But underneath the surface, we are witnessing a spike in transactions in areas such as East Vancouver's Main, Champlains Heights, Grandview Woodland, and Knight, with 79%, 40%, 34% and 30% of homes sold. Downtown areas, too, like Coal Harbour and Yaletown, are registering 18% of home sold respectively. First time home buyers are making the move quietly after spotting some good deals. The main takeaway was that the condo Sellers are becoming increasingly motivated. Condos are in the market where similar sizes and layouts are plentiful, so it has become an easy place for Buyers to compare. It only takes one desperate Seller to sell below market value, and the nearby condos will take that below market value home as a new benchmark. Most importantly, condo market are now more stagnant than others because buyers in this market can take longer (i.e first time home buyer living with their parents, or renters enjoy low monthly rent). This has created more urgency for condo Sellers, to a point where Buyers are now more comfortable with. Either way, it was a pleasant sight to see the uptick of sales in some areas. The bigger question remains: Is this another blip on the map?
For the month of July, the best performing neighbourhoods for condos were in Pitt Meadows, Maple Ridge and Burnaby East, all tied for 1st place at +0.5% each. Conversely, the areas with the most significant price drops were in Tsawwassen, Ladner and West Vancouver, posting -5.2%, -4.6% and -3.8% respectively.
The condo segment remained in a balanced market, with average days on market jumping up to 42 days (compared to 39 days in June). Month-to-month sale price continue to slip further by -1.1% (compared to -0.4% in June). Sale-to-listing (% homes sold) ratio remained dropped slightly as well to 14% (compared to 15.5% in June).

Here are the Three Trends I'm Observing:
1. Government-Backed
Growth in the private sector has been trending negatively since 2023. On the other hand, only government-adjacent business (education, healthcare, social assistance) has seen growth during the same time. For the past decade, Canada's productivity continue to trend downward, and taking business confidence has been tanking as well. Whatever Mark Carney's plans are, Canada needs a look in the mirror and pivot fast and hard. (Source: Statistics Canada)

2. Blame Oil Prices
The latest Canadian inflation in July rolled in at 3%, which is the highest since 2023. Government announced the exact script of blaming the oil prices. Most Canadians feel it in nearly all aspects of life, from food to mortgage renewals to home insurance policy. Worst yet is don't expect inflation to drop in September either. Oh, did I mention that the government's $.10/litre gas tax relief also ends in September? (Source: Statistic Canada)

3. Back to the Future... 2021
Home prices in BC and Ontario are dialing back to 2021 levels, while Alberta, Saskatchewan and Quebec are a completely different story. For BC and Ontario, home prices remain very high, but it's improving. (Source: WOWA.ca)

Recent Posts

GET MORE INFORMATION