

Real Estate Market Intelligence October 2026

Real Estate Market Intelligence
October 2026
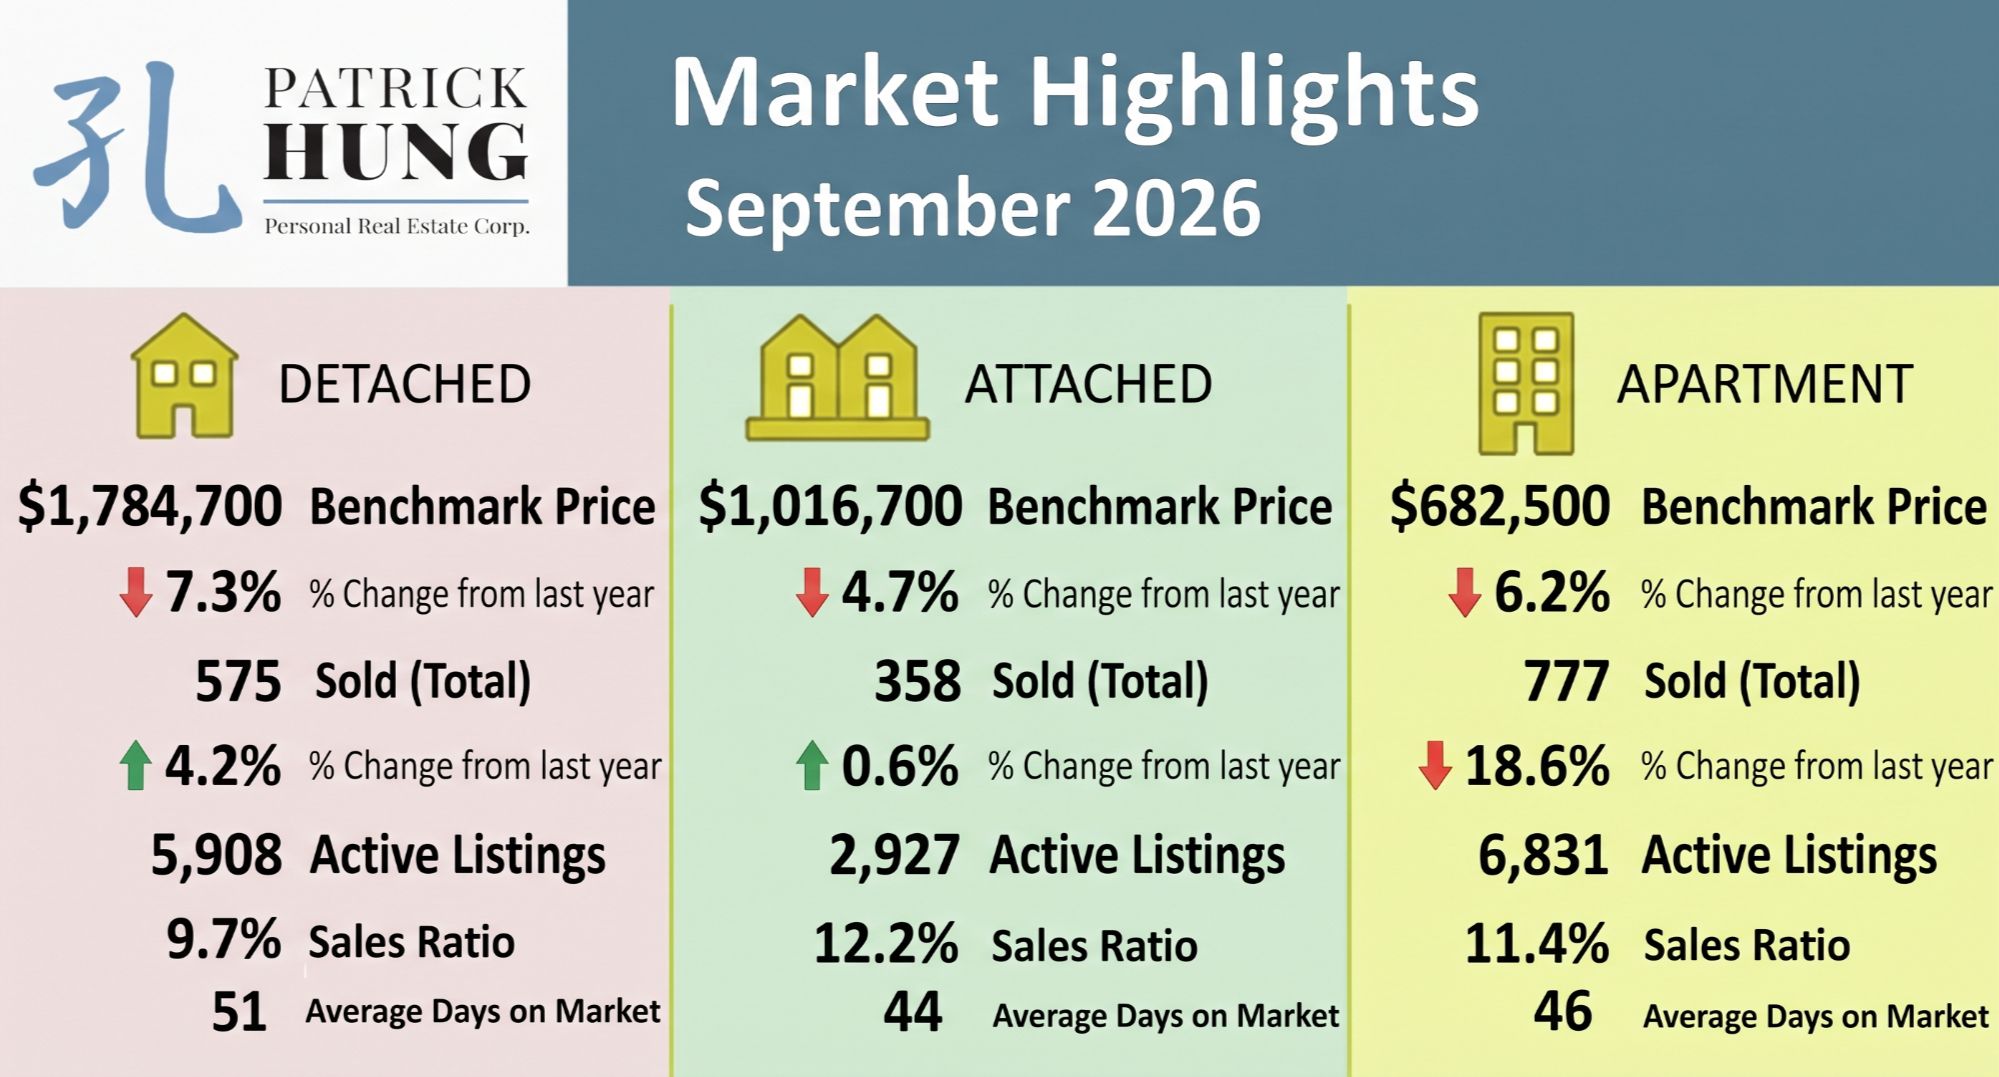
The autumn foliage is here and Vancouver has been blessed with an unusually warm and sunny weather so far in October. As for the Vancouver real estate, the last summer month of September was more of the same: less sales (demand) compounded with less inventory (supply). Thus, prices continue to drift downward slowly (-0.5% monthly drop). Although this may look like an small monthly price adjustment, but when compounded over time, this slow-burn has caused prices to drop by -2.1% in the past 3 months, and -5.5% in the past 12 months. What's the core theme this month is that the condo segment has dragged the entire market down in terms of sales, where year-over-year sales for apartment sales was down a whooping -18.5% compared to single house (+4.2%) and townhouse (+0.6%). Moreover, condo investment sellers continue their attempt to trim their real estate portfolio by offloading the once-smoking-hot smaller one-bedroom condo being in a fiercely-competitive yet lowly-demanded environment. Some macro key points I'm looking into this month:
1. Major banks continue to hike fixed mortgage rate and adding another layer of uncertainty to buyers.
2. BC residents will head to back-to-back elections from municipal to provincial governments within the next 2 weeks.
3. US to Canadian dollar exchange quietly roars near the year high
All the volatility, so let's take a deeper dive.
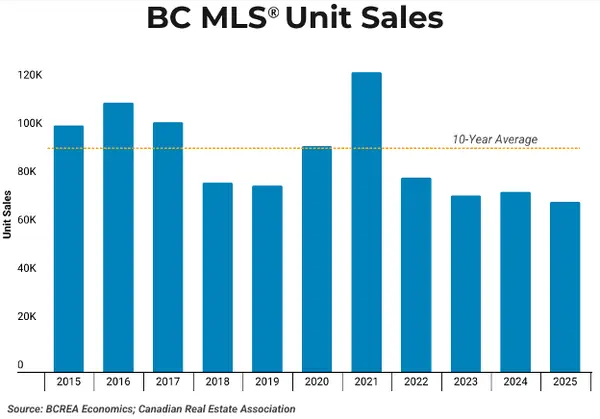
September marks another month of falling prices and healthy supply. Sales (demand) for the month was -25% below the 10 year average, whereas the total inventory (supply) is +24.3% above the 10 year average. The spread between the two is 49.3%, which has been hoovering steadily around the same 50% mark for the past 3 months. Structurally, this means there will almost certainly be more downward price pressure in the next 3-6 months. Given we are also going into the winter slower season, the spread will likely widen further.
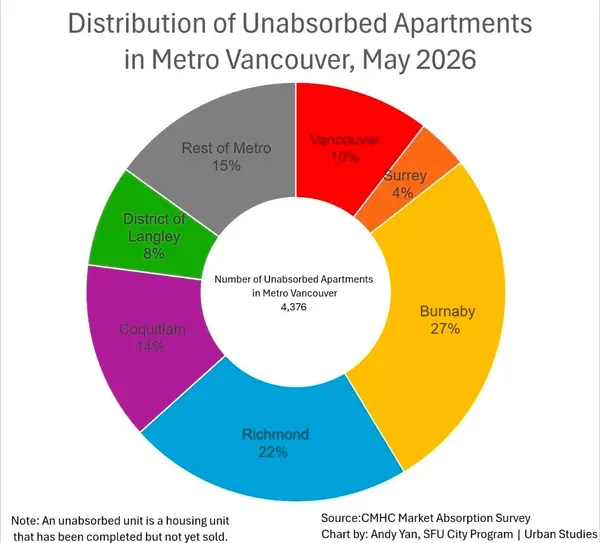
One of the key difference this time around is the glaring polarity of sales between segments. Based on the year-over-year stats, the single house and townhouse sales were performing along the same lines at +4.2% and +0.6% respectively, whereas condo sales took at beating at -18.5%. As the market continues to be driven by end-users, the demand for larger 1 bedroom or 2 bedrooms far out-weights the micro condos (sub 500 sf). As such, the inventory piles up. To add salt to the wounds, Greater Vancouver now has roughly 4,300 - 5,300 unsold new condos that's sitting on the market. This is a clear indication a bust in the condo market, and even with government policies stepping in, it would be very difficult to save any of the developers. On the other hand, single house sales were +4.2% year-over-year, which means buyers are more inclined to upsize and realize their single house dream. Having said that, year-over-year total supply across all segments are down nearly -9.1% from 17,270 units (Sept 2025) to 15,693 units (Sept 2026). In other words, even with less inventory, there is also less demand. Therefore, it has created further downward price spiral and prevented any market recovery.
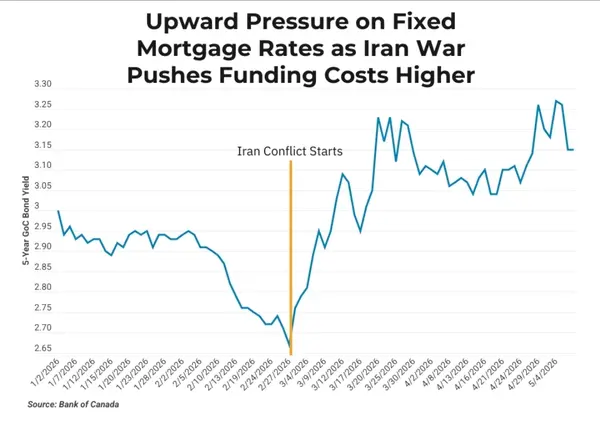
On the economic front, Canadian bond yield continue it's upward trajectory, such as the 5 year yield that has gone up by +0.3% since since Sept 1, 2026. This has created a ripple effect as major banks responded to hiking their 5 year fixed rates in the same manner, taking it now to 4.4% or more. On the other hand, 5 year variables rates are now sitting nicely around 3.6%, which makes the spread much more enticing for the Buyers. Some mortgage specialist are reporting that, even in as short as 2 months ago, 60% of the Buyers were going with fixed rates. Today, the script have flipped and 60% of them are going with variable. As buyers pivot to front load their risks, it has cast more uncertainty into real estate market. According to the OIS (Overnight Index Swap) that the market bets on rate hikes, 34% says a hike would take place Oct 28th, while 66% say of a similar hike on Dec 9th. General consensus is that rate will rip higher and as much as 4 hikes in the next 12 months, which means real estate recovery would be further delayed.
On the provincial front, BC residents will be heading to a back-to-back (municipal and provincial) election within a span or 7 days (Oct 17th and Oct 24th). Disclaimer: I am not endorsing any particular party or candidate. What I do know is that David Eby, the leader of NDP, has caused taxpayers millions of dollars on calling this early election, which I see as completely unnecessary. BC is already in a financial crisis, with the NDP ballooning the budget deficit to a historic $13.8 billion for 26/27 year alone, while at the same time social issues such as homelessness and drug usage continue to ravage the province. Whoever gets voted, BC will need to change hard, and with it will come pain, either in forms of cuts in spending (i.e less labour with deteriorating infrastructure, higher unemployment rate) or higher taxes (less take home income and/or lower business confidence). A tough pill to swallow either way.
On a global front, the 10 year US treasury note yields climbed to its highest since 2002, causing investors to pull back on stock near its record highs. The strengthening US dollar, compounded with the newly imposed tariffs, are certainly not helping the Canadian economy. One of the bright spots is that Mark Carney has officially green light the Pacific Link pipeline project with Alberta and BC, which can begin construction as soon as Sept 1, 2027 and will create 140,000 jobs and with a production of 1 million barrels a day. Yes this is still in the planning stages, and yes this will take many years to complete and won't solve the immediate issues on hand. I would argue that it's better late than never. Canada has had a long history of selling natural resources (natural gas, lumber, rare earth) to trade for imported goods. If there's light at the end of this pipeline, then let's get it started. In my opinion, this project is already 20 years behind, and the risk is just too high to NOT do anything for another 20 years. To coincide that, the real estate market has been ripping for over 20 years (2000-2022), and now the correction continues.
Some of the unique trends I've been observing:
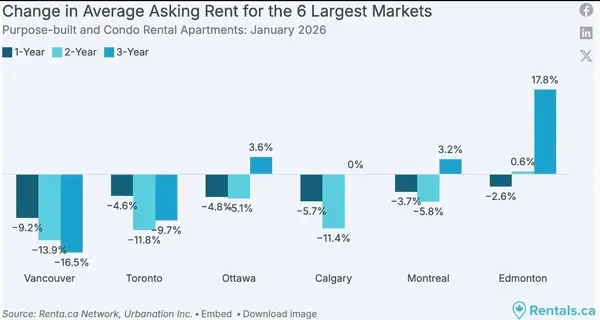
1. Asking rents in Canada has dropped by 24 consecutive months, down -4.2% from annually. For all properties type rents, Ontario led by dropping -4.8% annually, while BC with -2.9%, and Alberta by -2.6%. Increases were seen in Nova Scotia and Saskatchewan, both at +1.4% each. Surprisingly, Vancouver apartment and condo rents rose by +1.4% from August to $2,741, which is the largest monthly gain amongst the 6 major markets in Canada. This is an absolute disaster for investors in real estate; rising mortgage rates, rising property taxes, rising strata fees, and rising insurance premiums. All with falling rents and housing prices. The math isn't mathing and mom & pop individual investors are slow bleeding their savings.
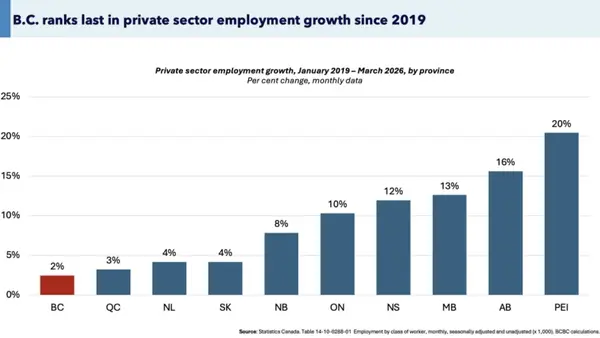
2. Canada's latest unemployment rate shot up slightly to 6.4% in August (up +0.1% from July), and saw 68,000 jobs loss in the same time. Employment in Quebec got hit the most (-49,000, -1.1%), followed by BC (-20,000, -0.7%). Alberta carried Canada with +23,000, +0.9% job creation. As we are aware that unemployment numbers always tosses up and down, but this will certainly have an affect on the Bank of Canada's upcoming rate decision on October 28th.
3. As mortgage rates are slowly creeping up by over +0.4% in the past 6 weeks, many will hear and see real estate social media posts urging buyers to jump in now to avoid even higher rates. Buyers will face a tough choice between buying now (lower rate, higher price), or buying later (higher rate, lower price). It's important to note the rates go up and down, as with real estate prices. It's impossible to time these two variables perfectly, and even if one does, they are just lucky. Buy according to your needs and your timeline, and not the noise.
4. October will be a huge month in terms of setting the pace for Q4 of 2026. It would be interesting to see if the aforementioned rising rate trend will drive the buyers demand into the market. Some sellers are also highly motivated to liquidate their home before the year ends.
Here are the 3 highlights for September:
- Total inventory of 15,709 units is the 7th highest July's total inventory in the past 25 years. Inventory softening trend continues in July, August and now thorough September. Some Buyers had high hopes of seeing more supply in September, but it just didn't happen. Some of the "lofty supply" now are the same listings that buyers are not willing to take on. Homes that are tastefully renovated, open layout and in a desirable location are still selling fast. Meanwhile, fixer uppers and dilapidated homes with land value only, these listings continue to sit on market much much longer.
- Price drops continue to pick up pace for the past 3 months, with average sales price dropping -2.1% from July to September. A monthly price drop of -0.5% may not be much, but adding these small increments over a span of 12 months can be highly disruptive, such as seeing the past a year price change at -5.5%. Imagine that going for another 1-2 years.
- As prices dial back to 2020-2021 levels, Buyers are now facing one of the most favorable times in the past 20 years. Ironic how the bearish buyers were complaining about prices were too high during the pandemic, but now when the prices dial back, they still don't make a move.
Here are the in-depth statistics of the September:
- Last month's sales were -25% below the 10 year September's sales average (compared to -20.7% in August and -18.7 in July). Demand took a hit during a traditionally busier time.
- Month by month residential home sales dropped by -9.1% from August.
- Month by month new home listings rose by +30.3% due to seasonality. Sellers are either coming onto the market or re-listing their homes at the lower price to make that final push before end of year.
- Last month's price drop by -0.5%. (compared to -0.6% in August)
- Sales-to-listing (or % of homes sold) ratio remained dropped to 10.9% (compared to 12.3%% in August) and has entered a Buyer's market as a whole. By property type, the ratio is 9.7% for single houses, 12.2% for townhouses, and 11.4% for condos.
Download September 2026 Greater Vancouver Real Estate Report
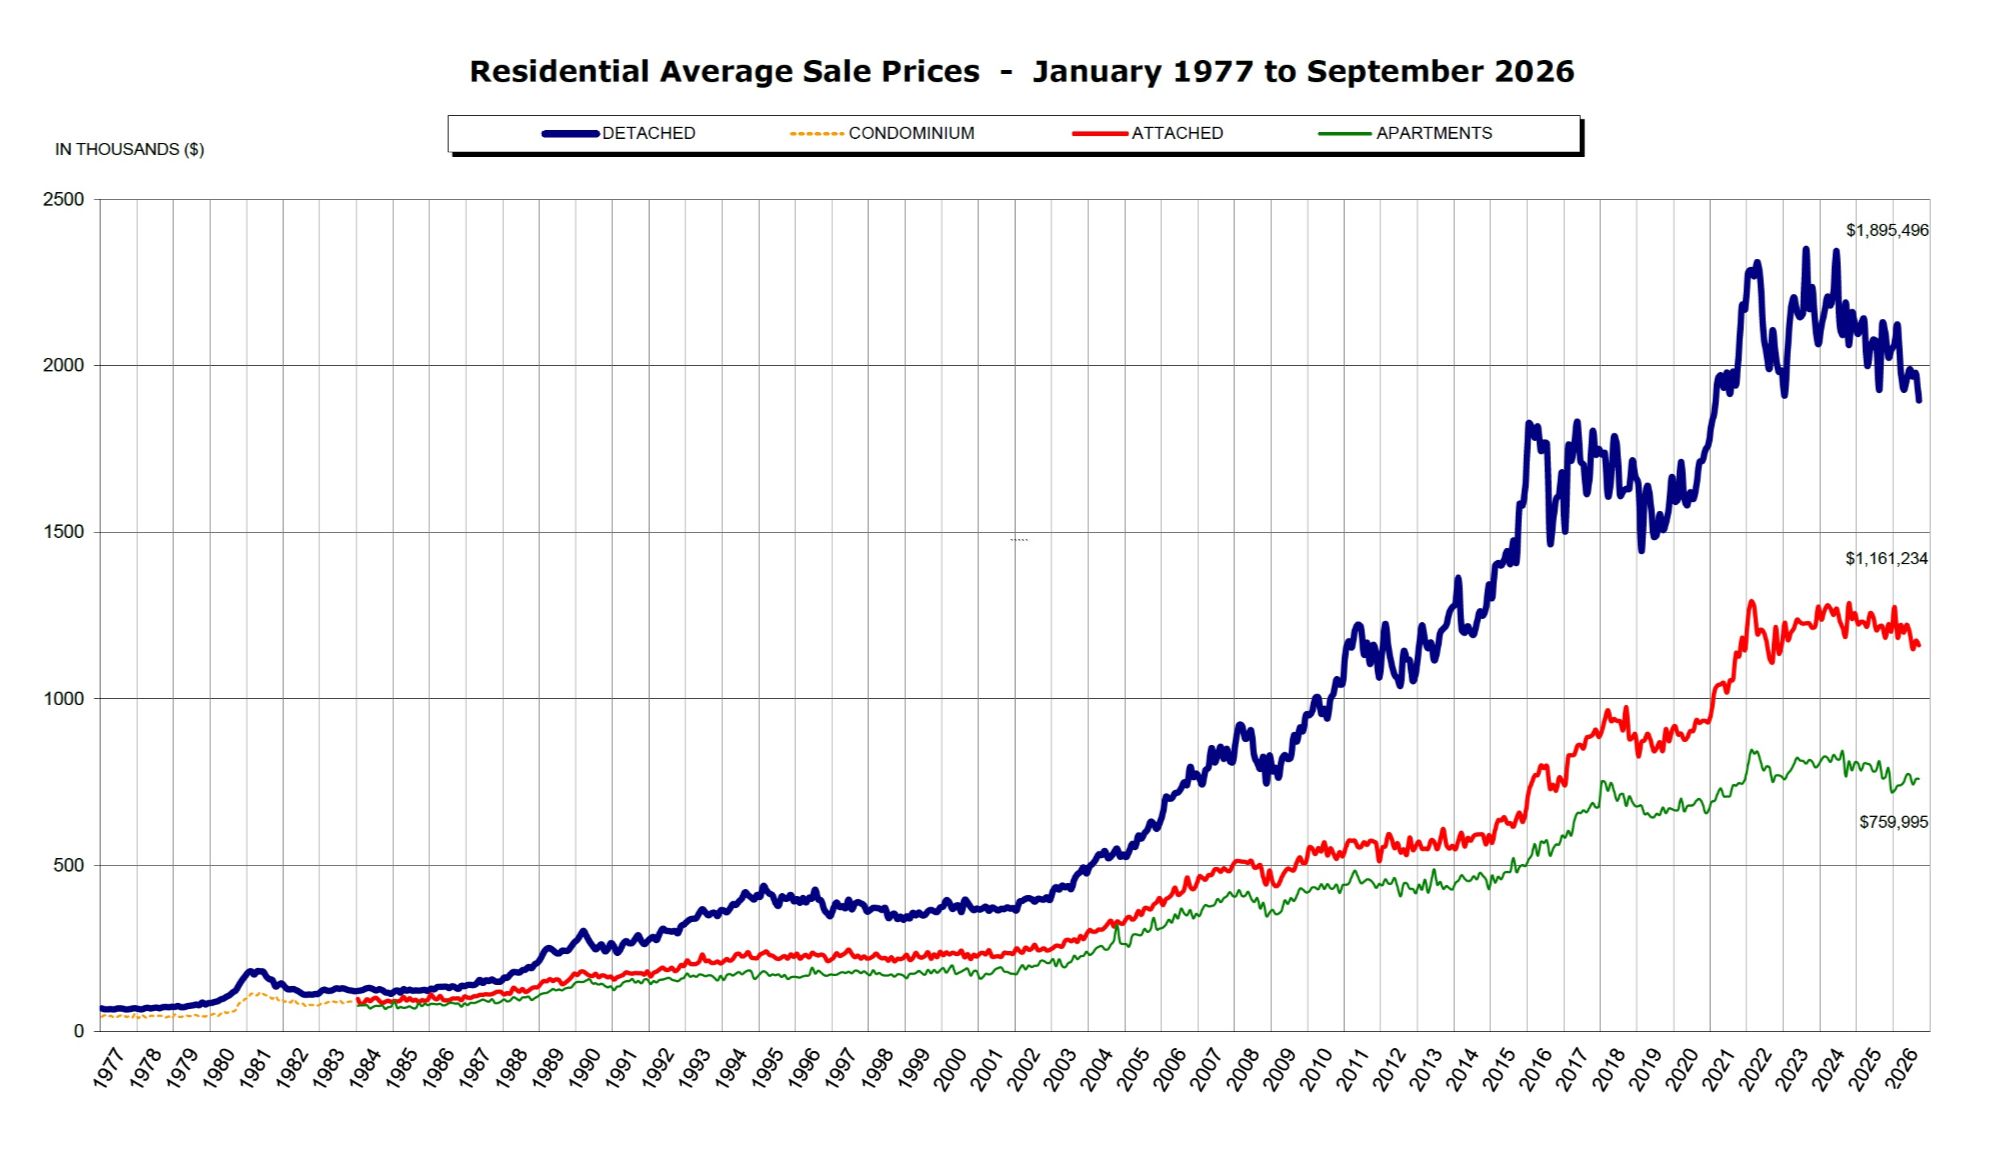
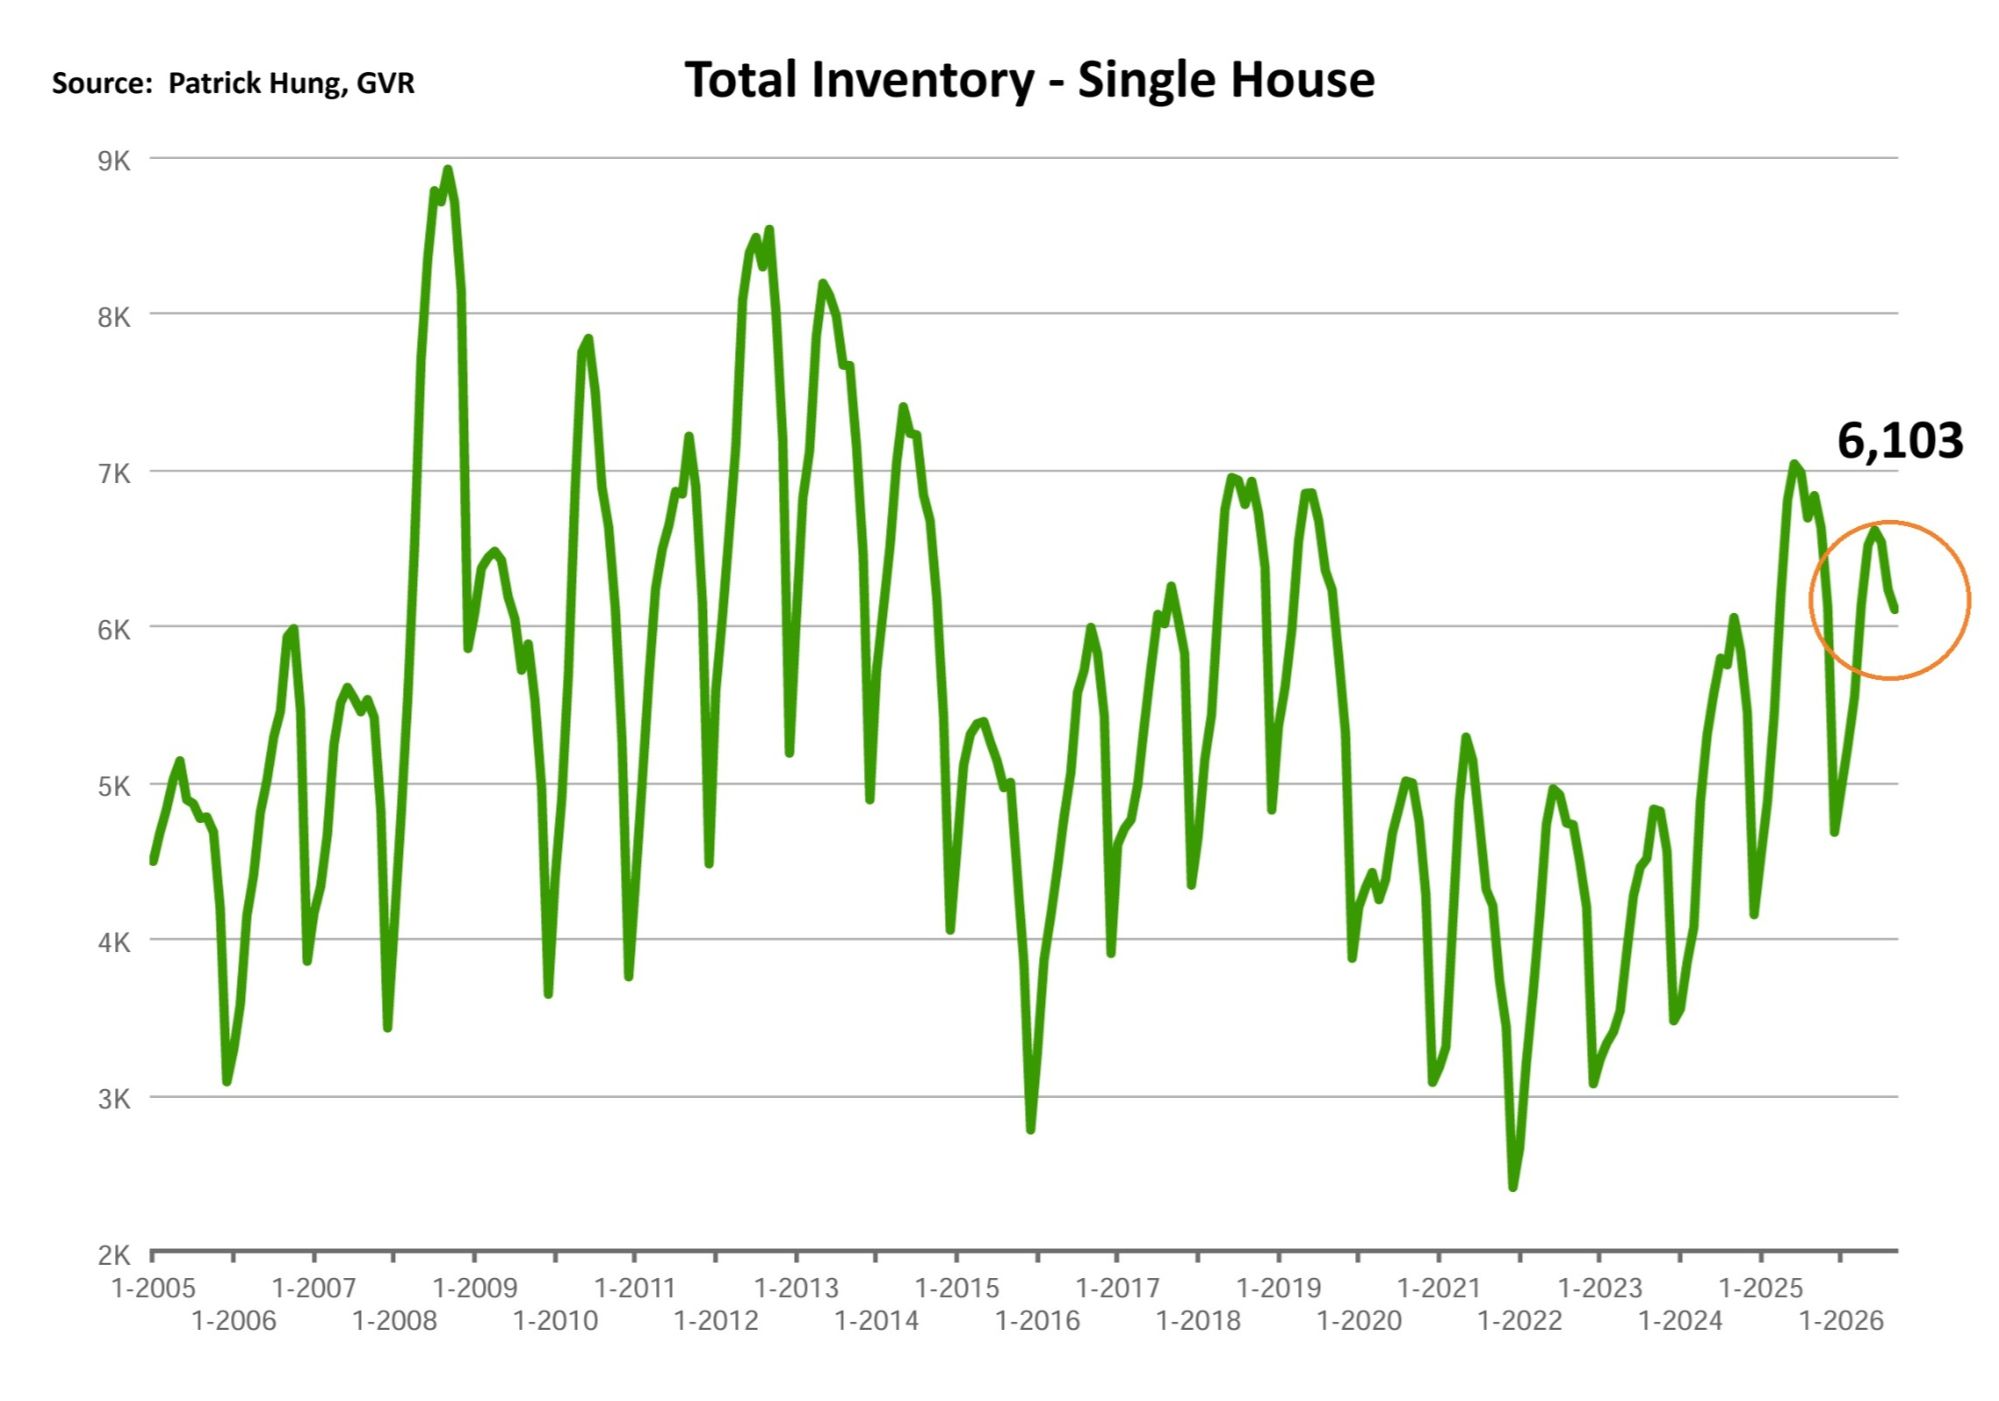
Even though the overall market remains in a sluggish environment, the single house sales has been performing on par with same time last year, posting a slight increase of +4.2% sales year-over-year. On the other hand, supply has been falling, with total inventory at -11.7% less than same time last year. In short, demand for single house has picked up, but prices continues the downward trajectory, from posting the latest monthly drop of -0.8%, to the past 12 month drop of -7.3%. Anecdotally, single house Buyers are aware that there are less to choose from, while prices have fallen to a point where it has become more affordable and acceptable. At the same time, disgruntled Sellers are more polarized; some who are highly motivated to sell have slashes their prices in an attempt to sell before end of the year. Meanwhile, hardcore stubborn sellers take their single houses off market and may decide to try when the market condition improves, whenever that would be. Thus, we are only seeing similar listings being re-package and re-listed, but not with a lot of new fresh listings.
As Buyers remain increasingly selective, the same single houses that are unsold remain on the market, while new supply are dwindling. This could easily create even more pent up demand in this segment. However, the question remains when the Buyers would pull the trigger. An interesting phenom that's I've observed is that as prices fall, the bars of entry have also become lower and lower, which is music to the ears for many prospective buyers. For example, only 8 months ago, some neigborhood's entry level homes were under $1.6m. Now it is under $1.5m. As this bar of entry shifts lower, more Buyers are attracted to climb that property ladder and reach the top of the of owning a single house. Note that this will favour only the Buyers who are STILL financially capable in this economically unstable environment.
For the month or September, the neighborhoods that registered the most price growth were Tsawwassen, Sunshine Coast, and Whistler, registering +2.9+%, +2.7% and +2.5% respectively. Conversely, the neighborhoods registered the most significant price drops were in the outskirts of Port Moody, Richmond, and North Vancouver, with -3%, -2.8% and -2.2% respectively.
The single house market has remained in the Buyers market for a third consecutive month, with average days on market increasing to 51 days (compared to 50 days in August), and month-to-month sales price dropped further to -0.8% (compared to -1.3% in August). Sales-to-listing ratio (% of homes sold) remained nearly flat at to 9.7% (compared to 9.6% in August).
Townhouse Market
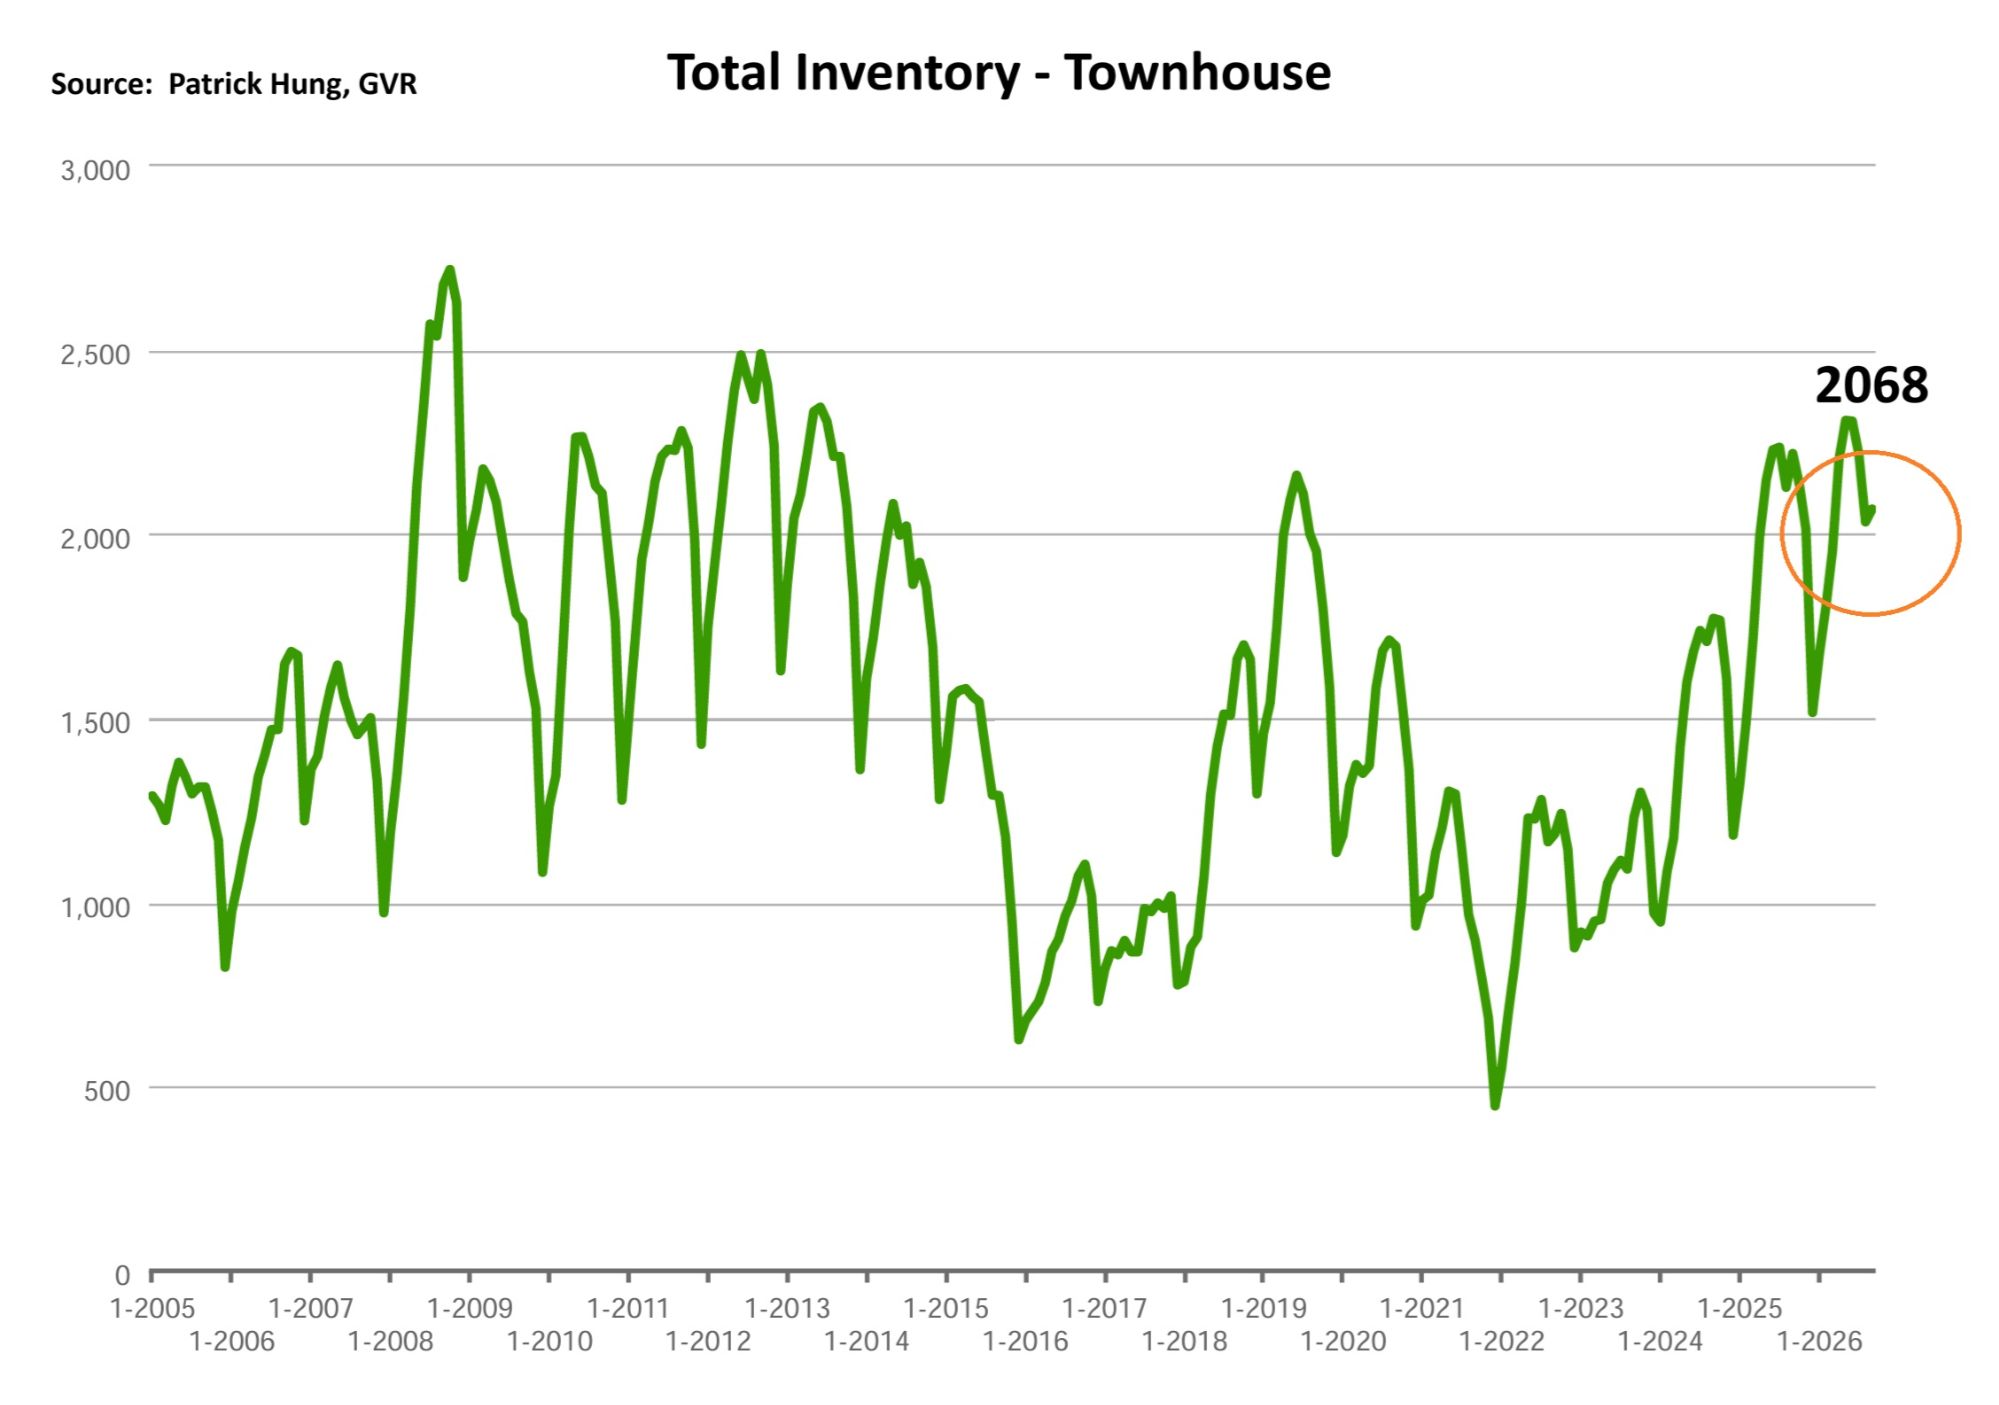
Across all segments, the townhouse market took the biggest monthly price hit in September, registering -1.2%. This comes at the backdrop of a rollercoaster price ride, with August (-0.1%) and July (-1.5%). Overall, the townhouse three month price drop of -2.8% is still performing mid-pack, compared to the single house, which dropped by -3.2% at the same time. Having said that, the townhouse segment continues to be eroded by newer duplexes and multiplexes, where their value is much more attractive. As sluggish as the townhouse sales are, I do see that the premium townhouses remains very attractive Buyers. Such townhouses are newer or renovated, in an ideal location (better schools) and is not the a main road that's priced $1.4m above in Metro Vancouver area. As buyer's budget holds around $1.4m, they can choose either a single house (lower price with limited supply) that will require major renovations. However, when looking at the more premium townhouses, Buyers can save the headache of time and cost of renovations.
With construction materials rising due to retaliatory tariffs between US-Canada, more and more savvy Buyers are shying away from these renovation projects. As such, readily renovated townhouses, whether premium or not, are faster at finding a buyers than other original conditioned listings. With this new environment of lower supply met with lower demand, it would be interesting to see how this tug-of-war would end up in townhouse segment. So far in a traditionally busier September and October season, there has yet been much of an uptick in sales.
In September, the areas with the most townhouse price growths were Sunshine Coast, Burnaby South and Burnaby East, registering +0.9% (tied for 1st and 2nd) and +0.6% respectively. On the other hand, the neighborhoods with the most significant price drops were Ladner, Port Moody and Tsawwassen, at -4.9%, -4.7% and -4.3% respectively.
The townhouse market remained in a balanced market but is very close to a Buyer's market, with days on market climbing to 44 days (compared to 39 days in August). Month-to-month sale price drifted down further to -1.2% (compared to -0.1% in August). Sales-to-listing ratio (% of homes sold) dropped sharply to 12.2% (compared to 15.1% in August).
Condo Market
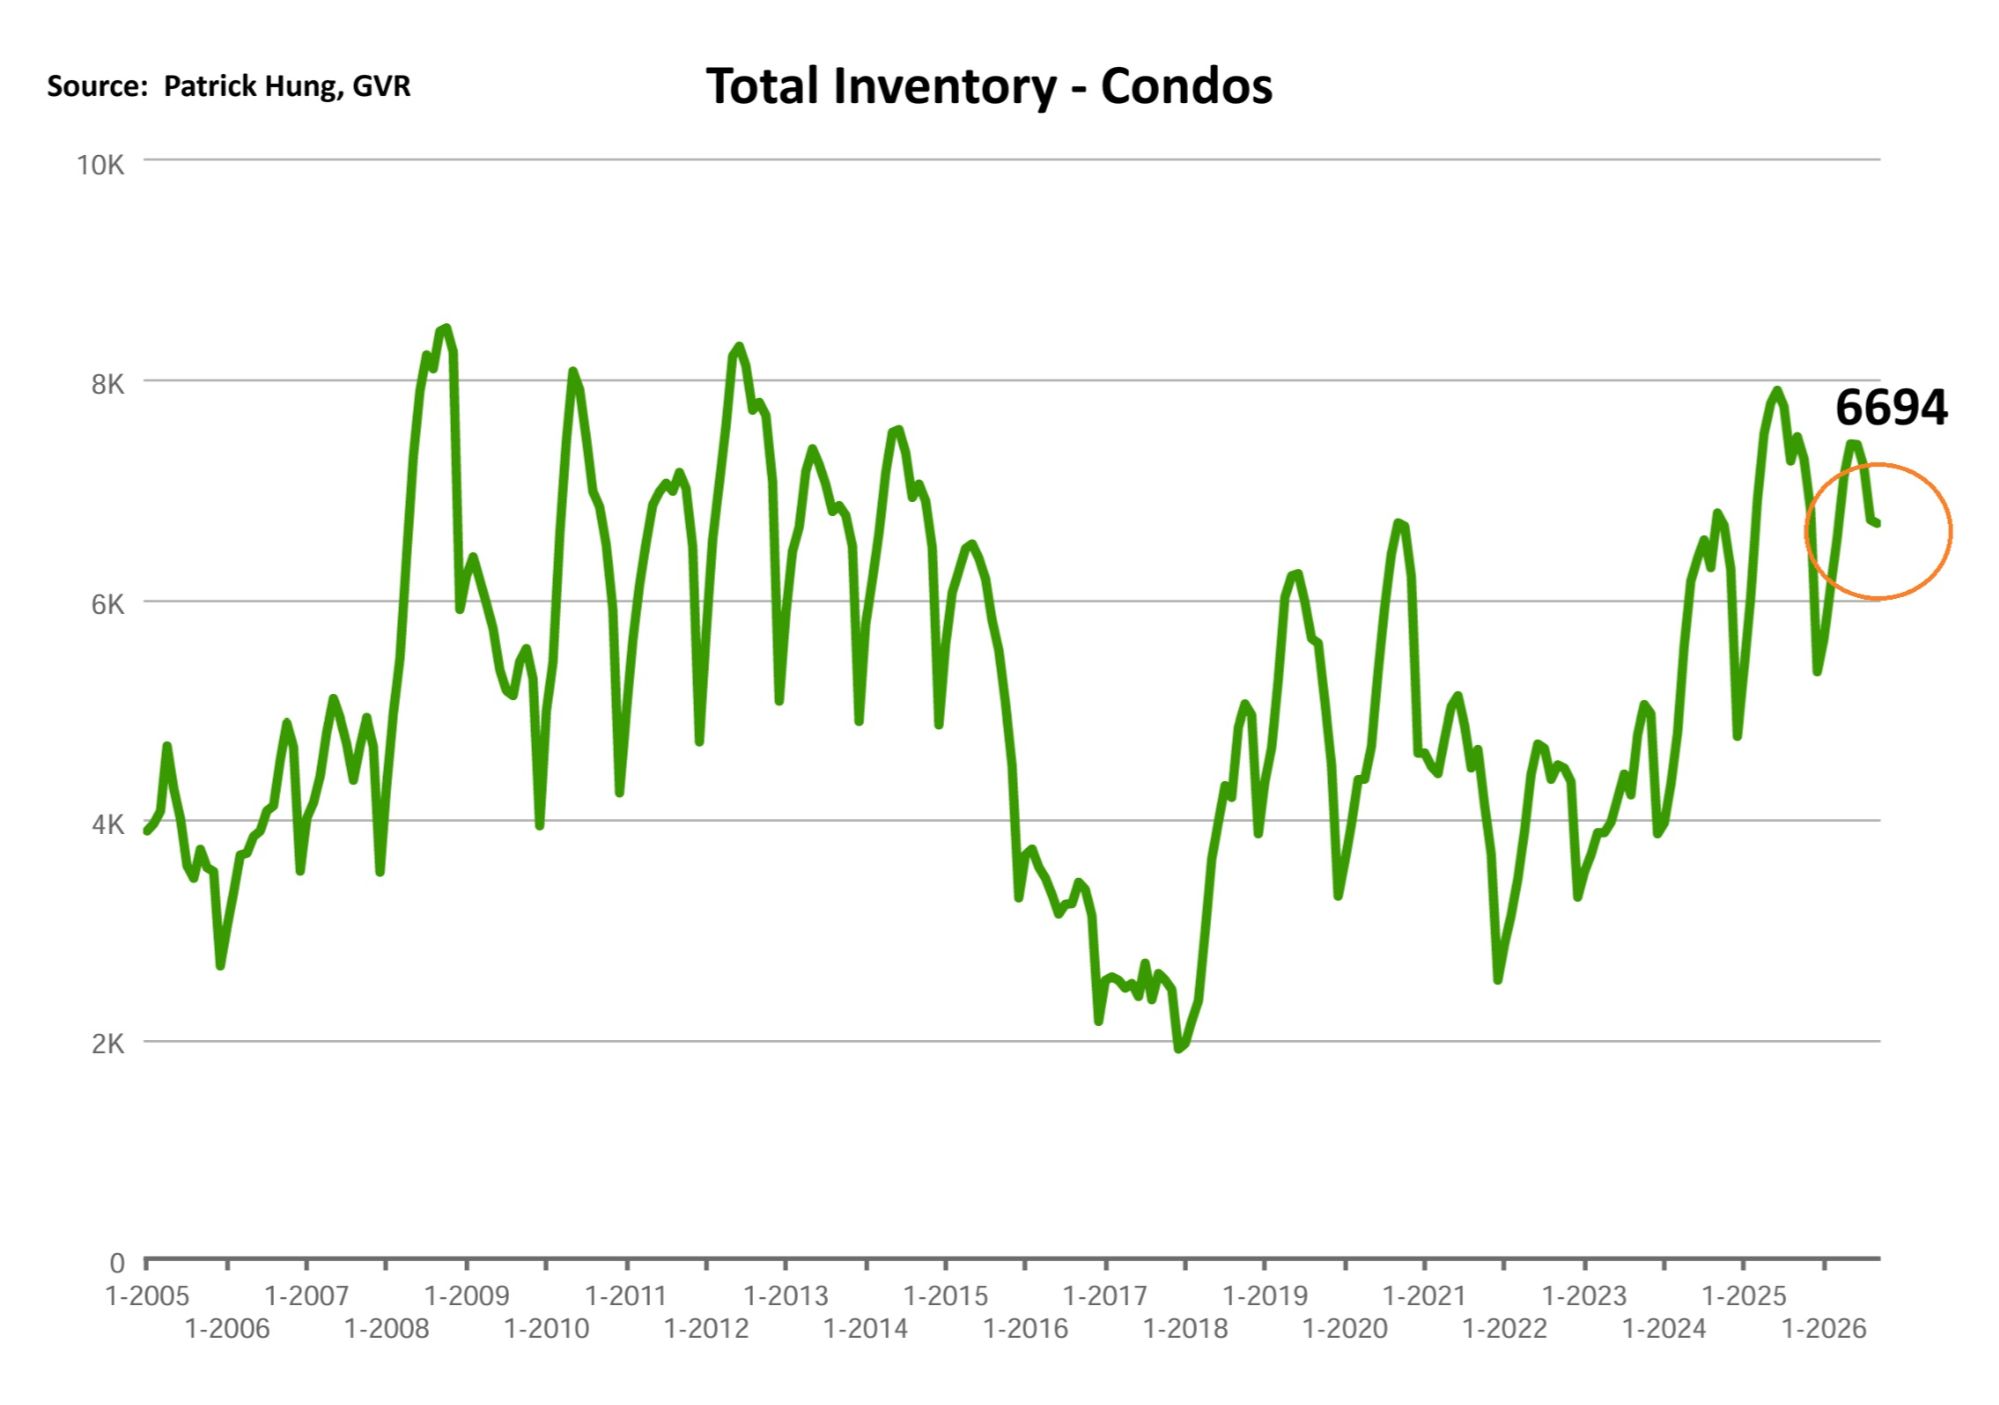
After a month of higher absorption rate in August, the condo market faced a relapse that weighed the entire market down, plunging sales at -18.5% year-over-year (compared to single house and townhouse at +4.2% and +0.6% respectively). Total inventory dropped slightly by -10.7% year-over-year, which still leaves us with a demand-supply gap of -7.8% less sales year-over-year. By the same time, condo price dropped has -6.2% from same time last year, and is seen mid tier compared to single house (-7.3%) and townhouse (-4.7%). On the bright side, last month's price drop (-0.5%) for condos is the best across the board (single house at -0.8% and townhouse at -1.2%).
What made the condo segment even more crowded with inventory is that investors are leaving in droves. Falling asking rents, falling sales prices, rising property taxes and rising strata fees are all the reasons the once-investor's-darling micro sub-500 sf 1 bedroom condos are having the hardest time to sell. Bigger 2 bed condos are still faring better in terms of sales, but still faces a lot of competition. With more projects that's slated to be completed by end of year (Oakridge mall) and early 2027 (Tower 6 Amazing Brentwood), there is bound to be more supply and more cut-throat action ahead. Condo sellers, position yourselves accordingly before the end of the year.
For the month of September, the best performing neighbourhoods for condos were again all in the outskirts of Whistler, Sunshine Coast, and Squamish, at +5%, +4.8% and +3.8%. Conversely, the areas with the most significant price drops were in Tsawwassen, Ladner, and West Vancouver, posting -4.2%, -3.7% and -2.2% respectively.
The condo segment shifted into a Buyers market, with average days on market shot up to 46 days (compared to 43 days in August). Month-to-month sale price drop eased to by -0.5% (compared to -0.2% in August). Sale-to-listing (% homes sold) ratio also dropped to 11.4% (compared to 13.7% in August).
Here are the Three Trends I'm Observing:
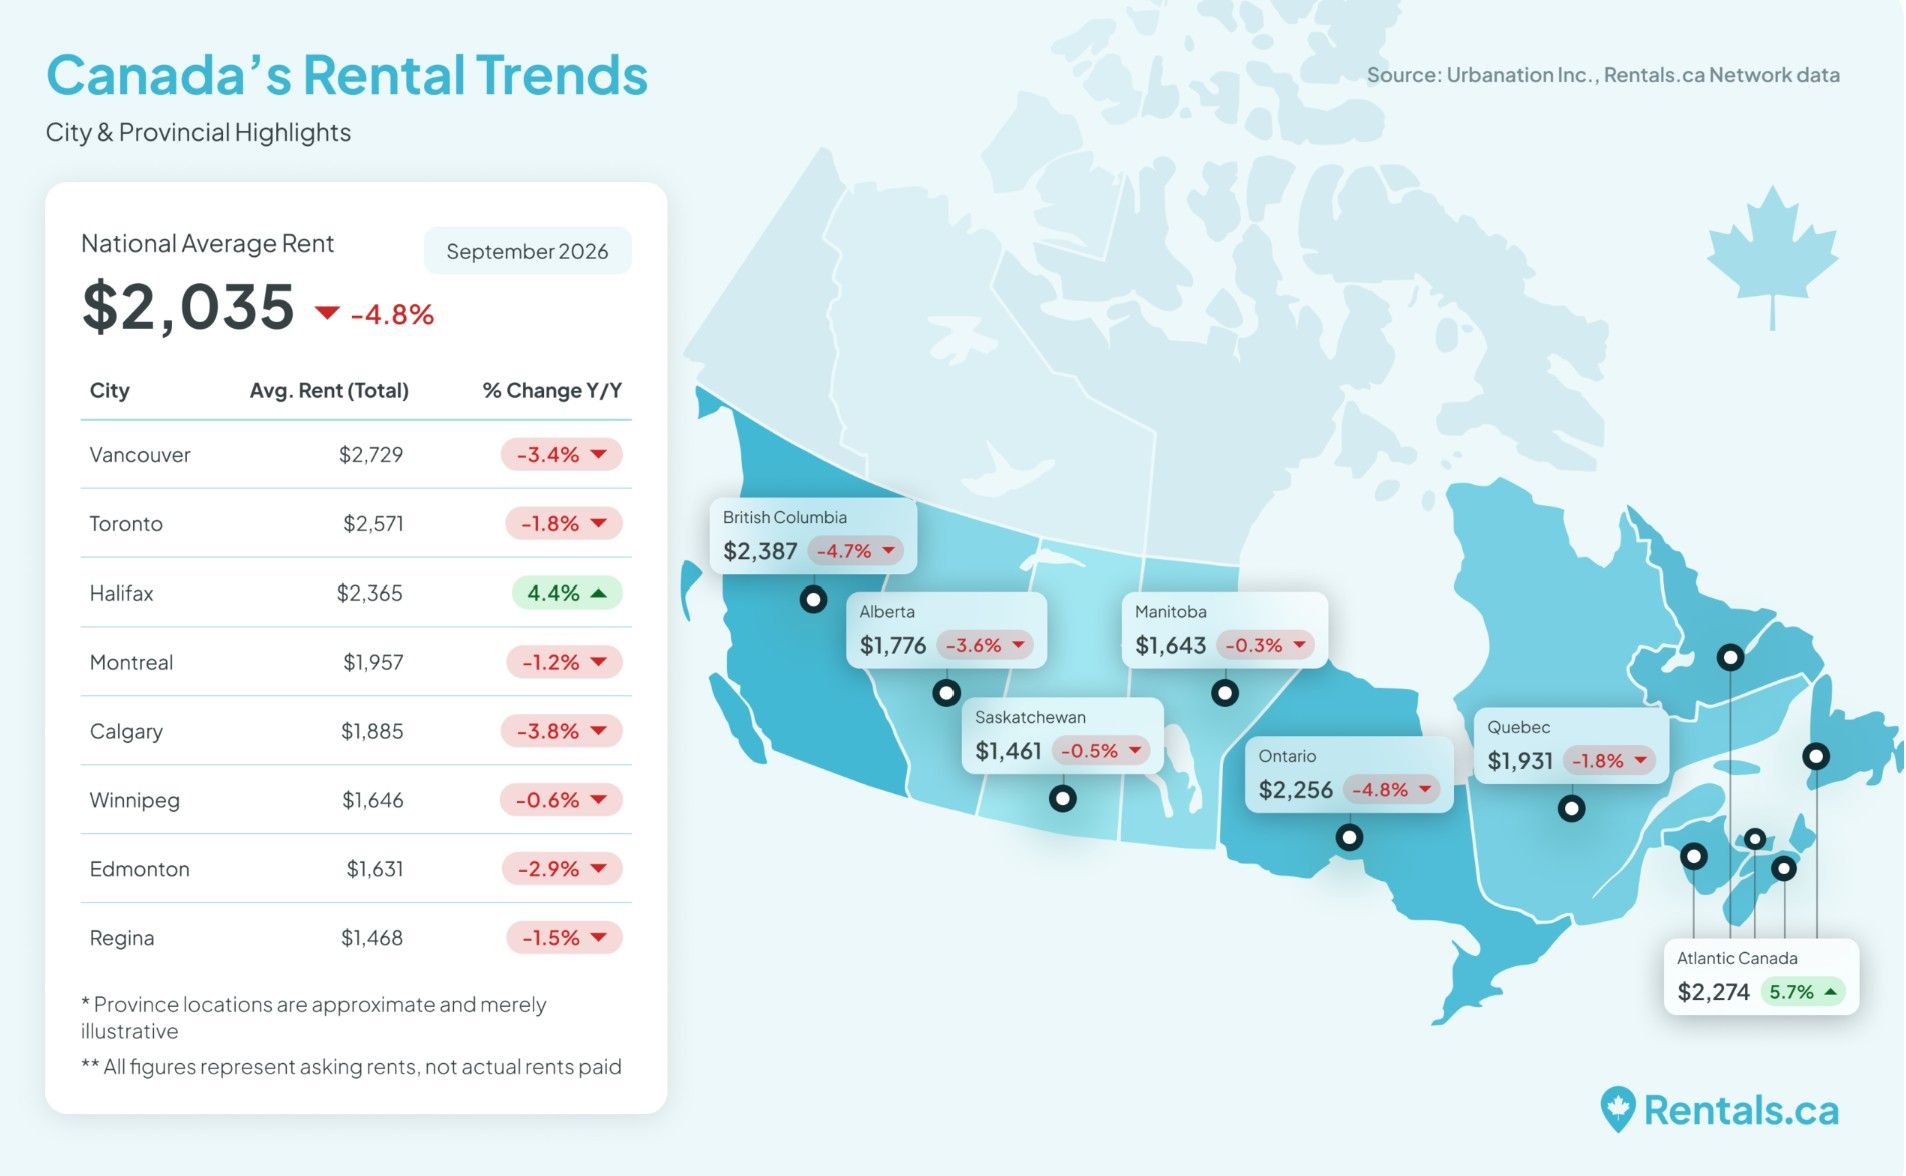
1. No Escape
Canadian rents has fallen for 24 consecutive months to $2,035. BC is still crowned with the highest rent, albeit falling by -4.7% to $2,387. With immigration down, rents down, and sale prices down, it's hard to see any recovery in sight. But wait, didn't Mark Carney has just dropped word that he might reopen the doors of immigration soon? More immigration may save the real estate sector, but it's damaging to the Canadian economy and productivity as a whole (i.e low skill low wage workers). It's a fine line. (Source: Rentals.ca)
2. Unfavorable Exchange
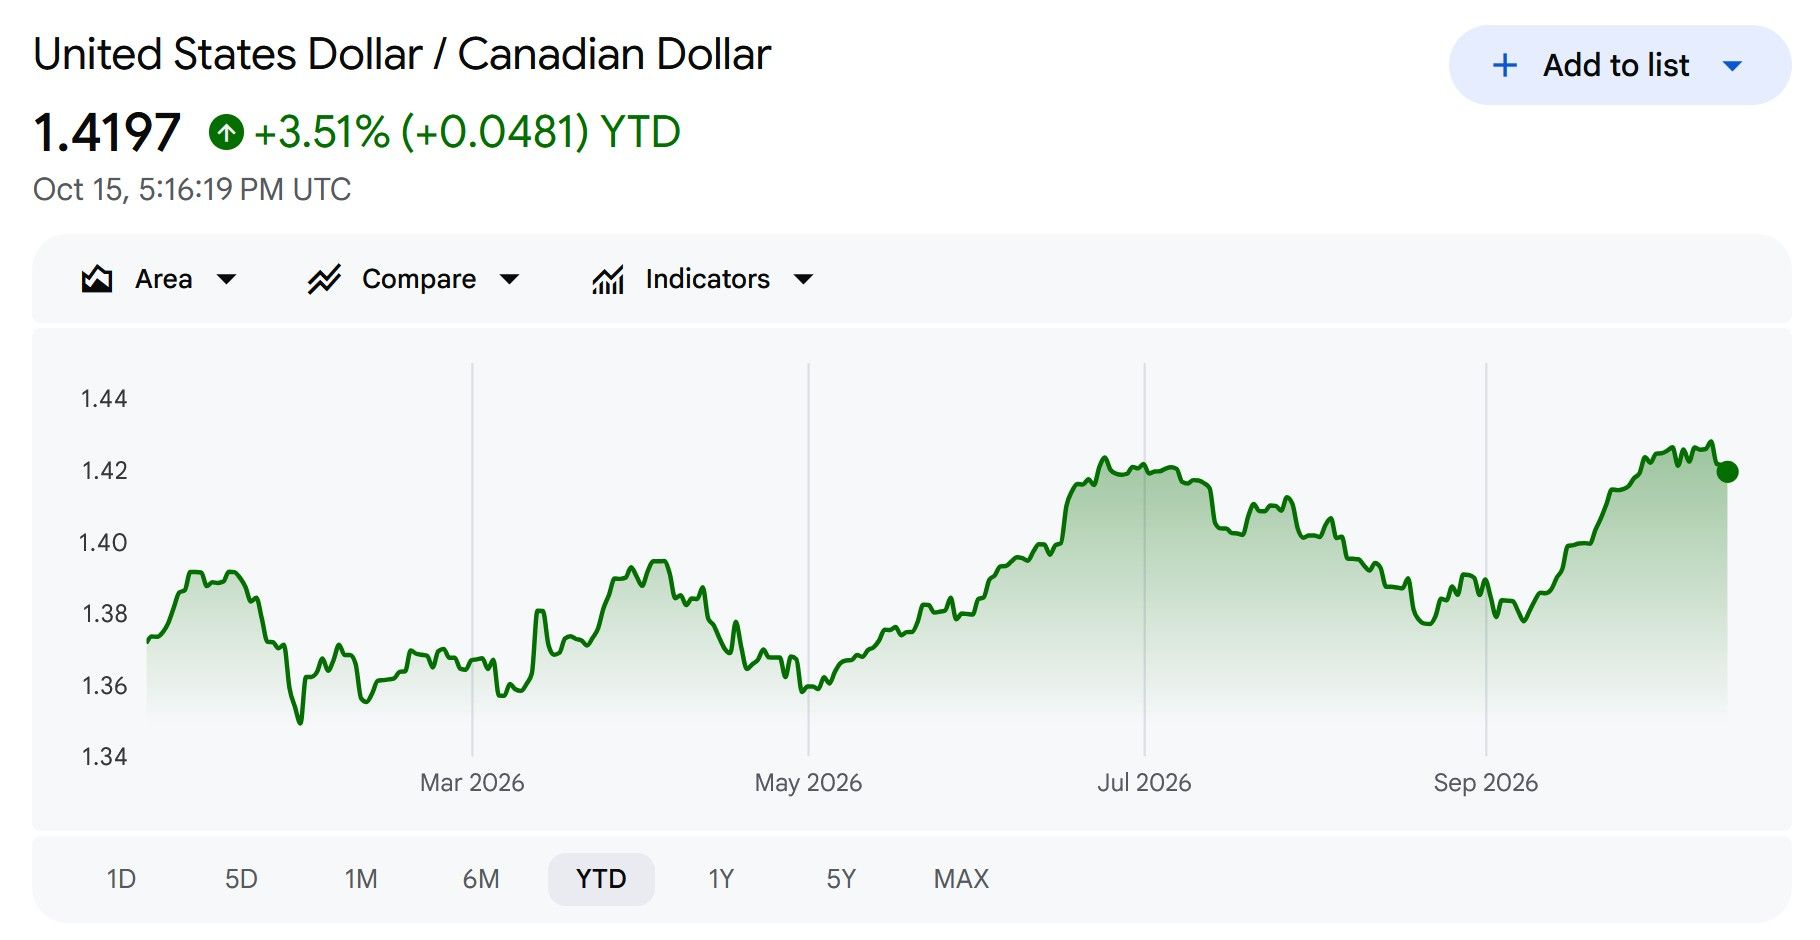
US to Canadian dollar exchange reached a new high for the year in October 12, touching $1 USD to $1.42 CDN. Here in BC, we certainly see more drivers coming from Washington to take advantage of the favorable exchange rate (for them). What this also means is a lot of hurt for the average Canadian household, especially in terms of food inflation. This may not be reflected yet, but will do so if it USD stays higher for longer. Monitor this space closely. (Source: Google Finance)
3. Similar Yet Different
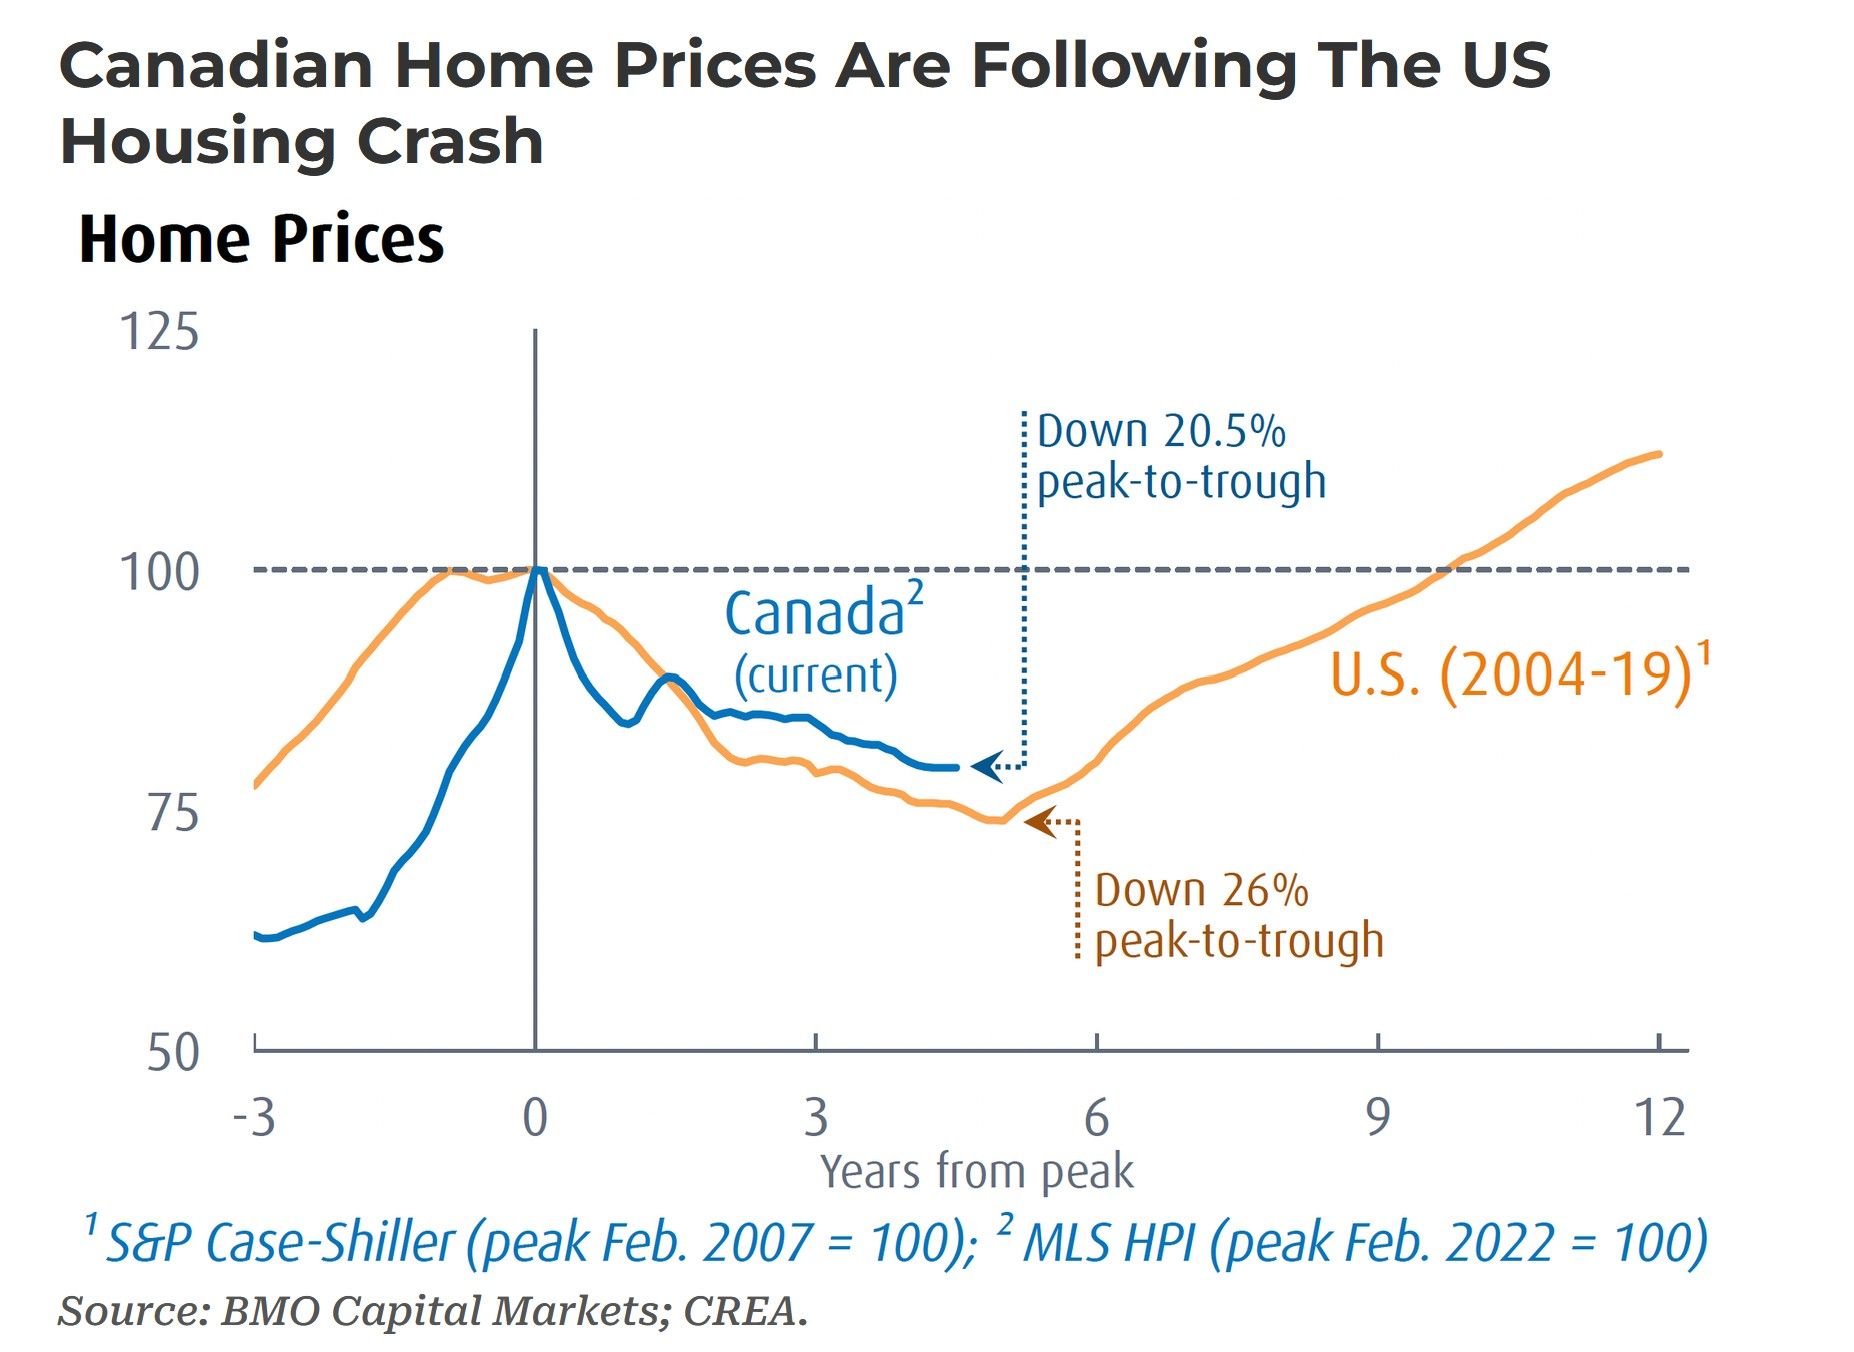
It's no mystery that the Canadian housing market has entered into a correction phase. To put things into perspective, Canadian home prices have fallen -20.2% since the peak at Feb 2022. On a macro level, that is still ways off compared to the US housing crash between 2004-2019, which came down to a whooping -26% peak-to-trough. What's also similar is that US and the Canadian housing market are both taking a beating now, with supply way up and demand remain muted. The two nations at odds, but with a similar housing pattern in mind. Only difference is that the US economy is faring better than Canada's. (Source: BMO Capital Markets, CREA)
Recent Posts

GET MORE INFORMATION